
Assembly Reversing Problems
These are some basic assembly reversing problems from https://github.com/kablaa/CTF-Workshop

The purpose of these challenges is to get some experience reversing assembly code. Try to figure out what the binaries are doing. To view disassembly machine code into assembly code, you can use something like objdump.
Hello World
First let's take a look at the assembly code:
$ objdump -D hello_world -M intel | less
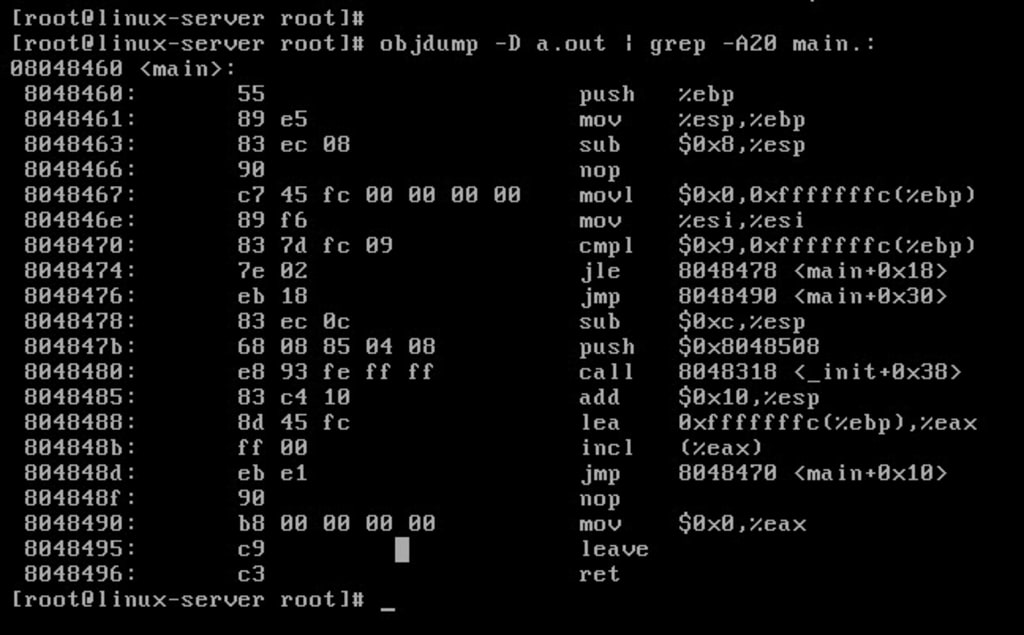
After searching through for the string main to find the main function, we see this:
Looking at the code, we see a function call to puts:
push 0x80484b0
call 80482d0 <puts@plt>
Looking through the rest of the code, we really don't see much else that is interesting for our perspective. So this code probably just prints a string. When we run the binary, we see that is correct:
$ ./hello_world
hello world!
If then
We start off by viewing the assembly code with objdump:
$ objdump -D if_then -M intel | less
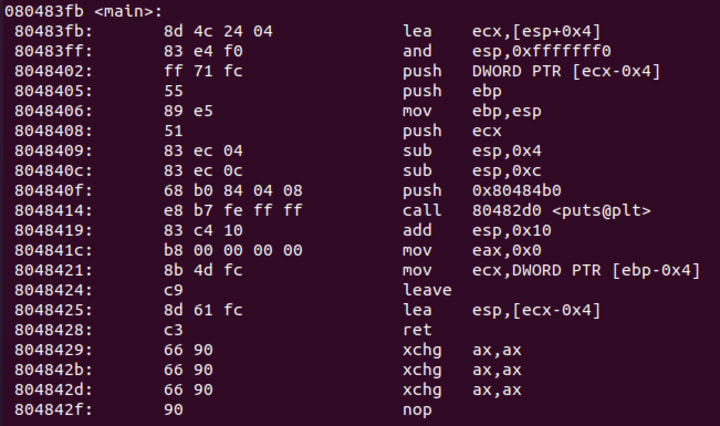
After parsing through for the main function, we see this.
We can see that it loads the value 0xa into ebp-0xc:
mov DWORD PTR [ebp-0xc],0xa
Immediately proceeding that, we see that it runs a cmp instruction on it to check if it is equal. If they are not equal it will jump to main+0x2e. Since it was just loaded with the value 0xa, it should not make the jump:
cmp DWORD PTR [ebp-0xc],0xa
jne 8048429 <main+0x2e>
proceeding that it should make a call to puts:
sub esp,0xc
push 0x80484c0
call 80482d0 <puts@plt>
So after looking at this code, we see that it should make that puts call. When we run it, we see that is what it does:
$ ./if_then
x = ten
Loop
Let's take a look at the assembly code:
$ objdump -D loop -M intel | less
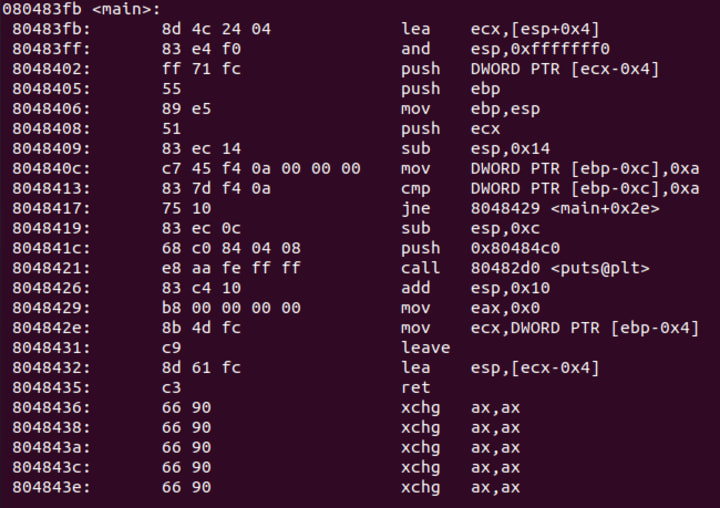
Quickly searching for the main function, we find it:
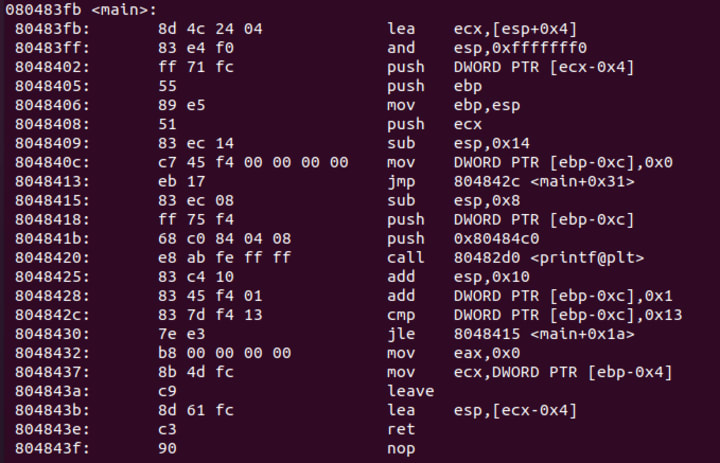
In this function, we can see that it will initialize a stack variable at ebp-0xc to 0, then jump to 0x804842c (main+0x31):
mov DWORD PTR [ebp-0xc],0x0
jmp 804842c <main+0x31>
Looking at the instructions at 0x804842c we see this:
cmp DWORD PTR [ebp-0xc],0x13
jle 8048415 <main+0x1a>
We see that it compares the stack value at ebp-0xc against 0x13, and if it is less than or equal then it will jump to 0x8048415 (0x80483fb + 0x1a). That brings us to a printf call:
sub esp,0x8
push DWORD PTR [ebp-0xc]
push 0x80484c0
call 80482d0 <printf@plt>
It looks like it is printing out the contents of ebp-0xc in some sort of format string. After that we can see that it increments the value of ebp-0xc, before doing the cmp again:
add DWORD PTR [ebp-0xc],0x1
So right, putting all of the pieces together, now we are probably looking at a for loop that will run 20 times, and print the iteration counter each time. Something that looks similar to this:
int i = 0;
for (i = 0; i < 20; i ++)
{
printf("%d", i);
}
When we run the binary, we see that it is true:
$ ./loop
0 1 2 3 4 5 6 7 8 9 10 11 12 13 14 15 16 17 18 19
Conclusion :
Here I've shown you how to reverse assembly problems, so you can try by yourself to reverse other problems like Echo, FD, and GetFlag.
Problem Files Available at Github : https://github.com/kablaa/CTF-Workshop.git
Reversing Challenge Files are Available at : https://github.com/kablaa/CTF-Workshop/blob/master/Reversing/Challenges
On the nest blog we will be working on Reversing with Ghidra and Debugging with gdb.
Ghidra :
Ghidra is an open sourced decompiler. A compiler takes source code like C, and converts it into machine code. A decompiler tries to do the opposite. It takes machine code and generates code that resembles it's source code.
However, since the process of compiling source code isn't like a 1 to 1 function, the code it gives us isn't always 100% correct.
Even with that it can be a great help, and really reduce the amount of time we spend reversing challenges (btw reversing is just the process of figuring out what something does).
gdb-gef :
This file was contributed to by deveynull (also made the hello_world binary)
So throughout this project, we will be using a lot of different tools. The purpose of this module is to show you some of the basics of three of those tools. We will start with gdb-gef.
First off, gdb is a debugger (specifically the gnu debugger). Gef is an a gdb wrapper, designed to give us some extended features (https://github.com/hugsy/gef). To install it, you can find the instructions on the github page. it's super simple.
A debugger is software that allows us to perform various types of analysis of a process as it's running, and alter it in a variety of different ways.
About the Creator
Motti Kumar
Hey guys i'm Motti Kumar and it’s a pleasure to be a guest blogger and hopefully inspire, give back, and keep you updated on overall cyber news or anything hot that impacts us as security enthusiast's here at Vocal Media.
Keep reading
More stories from Motti Kumar and writers in 01 and other communities.
Introduction to Assembly Language
I've just started learning Assembly Language since it is useful to perform tasks like Binary Exploitation and Reverse Engineering. This happens to be the the first big wall I need to tackle. I'll be sharing the knowledge I learn through the upcoming blogs, so if you're interested then stay tuned.
By Motti Kumar3 years ago in 01
Generative AI Revolution – Unleashing The Future Of Artificial Intelligence
Generative AI is a key part of the “Generative AI Revolution.” It refers to AI systems that can create new content, images, or even complete stories on their own. This differs from traditional AI. Its primary focus is on tasks like sorting or predicting from existing data. Generative AI introduces a big change. It lets machines create original content. This has led to advances in fields like content creation, art, and drug discovery.
By Bit Code Solutiona day ago in 01


Comments
There are no comments for this story
Be the first to respond and start the conversation.