
China Built 1.02 Million Chargers. The Profit Is Almost a Rounding Error.
TELD’s charging network is bigger than the fuel-nozzle count at China’s two oil giants. Its half-year operating profit is 30 million yuan. Here is the math behind the burn.
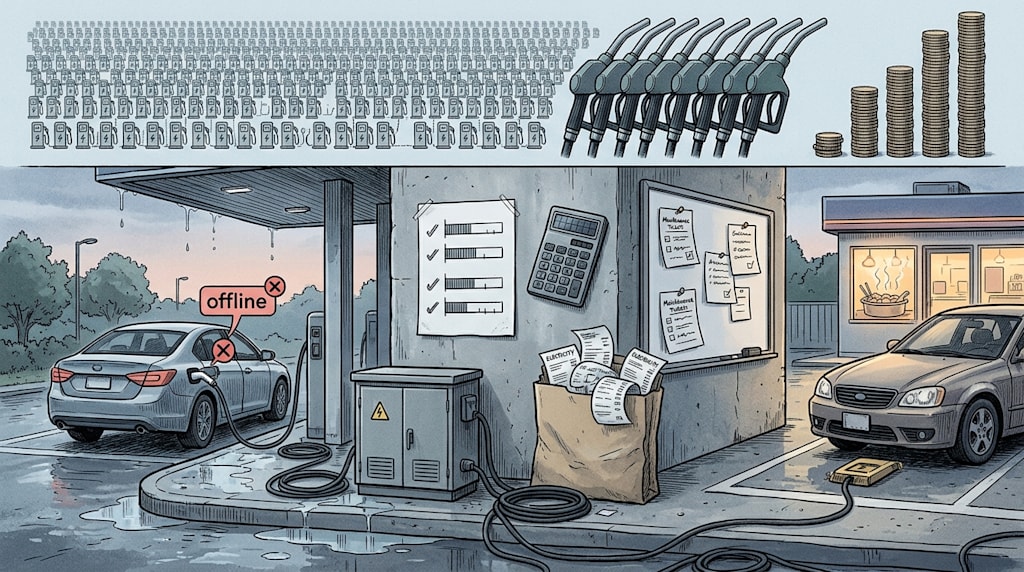
At six in the morning, a charging site on the outskirts of the city. Connector No. 3 is offline. The maintenance ticket reads “insulation test abnormality on the charging cable.” A ride-hailing car charges to 80%, unplugs, and leaves. The service fee is 0.36 yuan per kWh. Last month, the site’s average daily charging volume per connector was under 120 kWh. The break-even line is 180 kWh. The transformer hums inside its sheet-metal cabinet. The canopy leaks, dripping onto the concrete and forming a small dark patch.
Pull the camera back, and the numbers are more jarring. TELD’s charging points exceed 1.02 million. The two oil giants together operate about 60,000 fuel stations. At a dozen or so fuel nozzles per station, that is roughly 600,000 to 1 million nozzles. More charging points than fuel nozzles. And profits? In the first half of this year, PetroChina’s net profit was 155.7 billion yuan, with operating profit in its fuel-station segment at 11.4 billion yuan. Sinopec’s net profit was 39 billion yuan, with operating profit in its fuel-station segment at 5.7 billion yuan. TELD’s operating profit was 30 million yuan. After all that expansion, the checkout slip reads twenty-five cents.
This contrast cannot be dismissed with the phrase “poor management.” It lays the ledger structure of charging operations on the table: costs are front-loaded and rigid. Revenue is back-loaded and elastic. Scale expands quickly. Profit climbs slowly.
More chargers than fuel nozzles: a win for statistical definitions
1.02 million charging points and 600,000 to 1 million fuel nozzles cannot be compared directly. A fuel nozzle’s daily throughput, turnover efficiency, and revenue per point are far higher than those of an ordinary charging connector. One fuel nozzle dispenses thousands of liters of fuel a day. One charging connector delivers just over a hundred kWh a day. Charging points also split into fast and slow charging, with huge differences in power utilization. Terminal counts create an illusion of scale. Per-connector throughput and site-level returns decide survival.
More meaningful comparisons are average daily charging volume per connector, site utilization, site-level EBITDA, and payback period. At one site last month, average daily charging volume per connector was 120 kWh. The service fee was 0.36 yuan per kWh. After deducting electricity costs, rent allocation, equipment depreciation, and maintenance labor, how much is left on the books? The operations manager only has to punch it into a calculator. At many sites, the result is negative. A site with negative numbers will not turn positive just because the national charger count crossed one million.
Costs come first; revenue watches faces later
The cost structure of charging operations is front-loaded and rigid. Land or site rent must be paid first. Transformer capacity expansion must be done first. Charging equipment must be bought first. Power capacity expansion must be negotiated first. Maintenance staff must be assigned first. Before every site is built, the money has already gone out.
Revenue is back-loaded and elastic. Service fees are squeezed by local guidance prices and peer price wars. Per-connector utilization needs time to ramp up. User habits need time to develop. Many sites run below break-even for long periods. The larger the scale, the heavier the depreciation burden, the longer the maintenance radius, and the higher the upfront capital occupation. If the site-level model does not work, scale becomes a source of losses.
TELD’s ability to turn an operating profit is already ahead of the pack in this industry. But the 30 million yuan scale shows it is still a considerable distance from “scale bringing profit.” Turning an operating profit positive matters. Quality still needs examination: how much comes from government subsidies and other income, what the financial expenses and depreciation policies are, whether asset impairments are pressing down, and how much equipment sales or EPC revenue contributes. Positive operating profit does not mean the core charging business has strong self-generated cash flow. Relative to its asset scale and capital expenditure, this profit remains thin.
The printer in the finance office is still spitting out electricity bills. The A4 paper comes out hot and curling.
Why the cash keeps burning: a bet on pricing power after the shakeout
If profits are this thin, why is capital still rushing in? The logic of this business is survival first. Profit comes later, if it comes.
Charging networks have some network effects and clear locational scarcity. High-quality sites are limited, and first movers can build exclusive barriers. Once users are bound to an app and membership system, switching costs rise. After the industry shakes out, subsidies recede, and small and mid-sized operators are dragged down by price wars and capital expenditure, survivors’ per-connector utilization and pricing power may improve together. Today’s low profit is a strategic price the industry has chosen: use capital to buy scale, use scale to buy position, use position to gamble on the endgame.
One regional manager, in the hottest year for capital, signed forty site leases. Eleven of them still average less than 100 kWh per connector per day. At the time, he did not calculate the site-level model. He counted locations. Now he visits six of those sites every month, because three are two months overdue on rent.
This gamble has several preconditions. Not all of them hold.
First, will the endgame be one national network? Charging networks do not have winner-take-all dynamics like social software. Sites are dispersed, regions are fragmented, and grid access is affected by local forces. Public buses, logistics, ride-hailing, highways, and destination charging are different scenarios. The industry is more likely to move toward regional oligopolies than a national monopoly. The story of one national network sounds good. The site-level economic model and regional density are the questions that matter.
Second, will the price war drag everyone down before the shakeout? When service fees are pressed close to the cost line, the larger the scale, the faster the bleeding. Financing capacity may become the lifeline more than operating efficiency does. Players with strong financing capacity are not necessarily efficient operators. Efficient operators are not necessarily able to survive the capital cycle. The last one standing may not be the one with the best model. It may be the one with the lowest cost of capital and the strongest balance sheet.
Third, the two oil giants have not sat idle. They are converting fuel stations into integrated “fuel + electricity + non-fuel” energy stations. They use the high-frequency traffic and existing sites of fuel stations to funnel demand into charging. Their site-level economic model is much lighter than building from scratch on newly acquired land. The kings of the fuel era may not win the charging era. The cash flow and locations in their hands are enough to make the “survive to the end” list more crowded.
The oden in the convenience store at the fuel station is still steaming. Next to it, the ground locks of two charging spaces are occupied by a gasoline car.
Network effects may be overstated; the hard moat is elsewhere
The charging industry likes to talk about network effects. Network effects here are not as strong as in social products. User switching costs are not high. Multi-platform price comparison is normal. Switching between charging apps is nowhere near as hard as switching social accounts. What is scarce is long-term leases on high-quality sites, power capacity, local relationships, site operating efficiency, and low capital costs.
Judging a charging operator cannot rely on charger count alone. Charger count gets you in the door. It does not tell you whether the business makes money. Look at average daily charging volume per connector, service fee per kWh, site-level EBITDA margin, site payback period, and the ratio of operating cash flow to capital expenditure. These five metrics are more useful than the slogan “the nation’s largest charging network.”
Maintenance tickets cover the whiteboard. The canopy is still leaking. Charging cables drag on the ground. On the wall is a sheet of A4 paper with five metrics handwritten on it, next to last month’s numbers. No one stands in front of the paper shouting slogans. Someone punches the numbers into a calculator, then stuffs the repair ticket for Connector No. 3 into a tool bag.
The endgame is more likely layered competition than one winner
Put charging operations into the larger picture of energy retail. The endgame is most likely layered competition, not one national chain taking all. Regional oligopolies survive on density and operating efficiency. The two oil giants, grid companies, city investment platforms, and parking-lot asset owners control locations and power capacity. They become integrated energy-station asset owners. Third-party operators handle operations management, specialized scenarios, and regional density. Public buses, logistics, ride-hailing, highways, and destination charging each have their own model. No one can use one playbook to take all scenarios.
The two oil giants’ advantages are concrete. Existing sites, cash flow, brand, and non-fuel traffic are advantages. Fuel-station area, safety regulations, grid capacity expansion, refined charging operations, and conflicts between fuel and electric vehicle traffic flows are constraints. They are more likely to become integrated energy-station asset owners than to do every detail of charging operations themselves. The value of third-party operators lies in making per-connector utilization, service fees, maintenance costs, and financing costs sustainable. Having the most chargers is not the point.
Back to that site
The next morning, Connector No. 3 is fixed. The canopy is still leaking. There are two more maintenance tickets. The A4 paper is still on the wall. Several new lines of numbers sit next to the five metrics. The service fee is still 0.36 yuan. Average daily charging volume per connector has climbed to 131 kWh, still short of 180. No one shouts “survive to the end.” Someone folds the electricity bills, puts them in a file bag, and zips it shut.
Charger count gets you in the door. The income statement decides who stays. After all that expansion, the ones who can settle the bill will not be those whose checkout slip reads twenty-five cents. They will be the ones who can still keep the accounts straight while others are bleeding.
About the Creator
Jin
Writer of reamstories
https://reamstories.com/jin
Enjoyed the story? Support the Creator.
Subscribe for free to receive all their stories in your feed. You could also become a paid subscriber, letting them know you appreciate their work.
Comments
There are no comments for this story
Be the first to respond and start the conversation.