
BYD Kept the Sales. It Lost the Margin.
The Q3 report turned the profit story upside down, and 2027 looks harder than the headline numbers suggest.
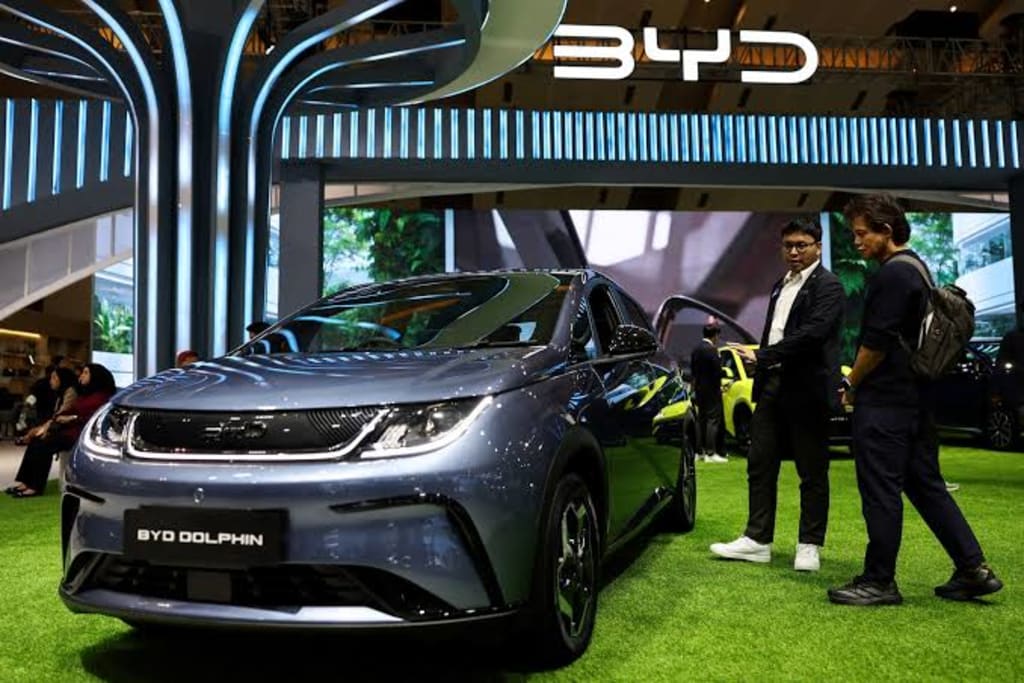
BYD’s Q3 report shows a weaker operating trend than the half-year report did. At the half-year stage, the market could still believe a simple story: sales were recovering, per-vehicle profit had bounced, gross margin was rising, and an inflection point might be near. Q3 broke that story. Sales rose. Per-vehicle profit did not hold. Gross margin fell.
This does not mean BYD’s competitive position has collapsed. The domestic NEV market is weak. Retail sales were still down 12.8% year on year through Q3. Price competition has not eased. Demand has not delivered extra volume. Against that industry beta, BYD still beat most competitors. That is hard to do.
But public markets are harsh with leaders. They were harsh with CATL recently. BYD may be next. A leader’s valuation already assumes share, earnings quality, and future growth. When sales and profit move in opposite directions, the market reprices those assumptions faster than it does for smaller companies.
Sales grew. Earnings quality did not.
The important Q3 change is not whether sales held. It is whether sales growth turned into better earnings. At the half-year mark, the market was willing to accept the chain: per-vehicle profit rebounds, gross margin rises, inflection point confirmed. Q3 broke the chain. Sales volume rose, gross margin fell, and per-vehicle net profit failed to hold. Scale did not fully cover price competition, product mix, and cost pressure.
Per-vehicle profit is an output. Several inputs sit behind it: domestic discounts, dealer rebates, model mix, export share, shipping and tariff costs, currency moves, lithium carbonate and other raw materials, and R&D and selling expenses. Higher sales do not automatically raise per-vehicle profit. If growth comes from price-sensitive models or from markets with deeper discounts, more volume can mean more profit pressure.
The domestic and overseas margin gap deserves more attention. In the half-year report, BYD’s overseas revenue share was 52.57%. Overseas gross margin was 21.71%. Domestic gross margin was 15.67%. That is a 6-point gap. Overseas markets carry the profit. Domestic operations are roughly break-even or marginally profitable.
If export share rises, consolidated gross margin should rise, all else equal. In Q3, consolidated gross margin fell. That means either domestic profitability weakened more than expected, or overseas gross margin came under pressure. This is a bigger warning than a soft per-vehicle profit number. It questions the durability of BYD’s current profit structure.
The Q3 report does not show that BYD cannot sell cars. It shows that BYD can sell cars, and that selling them has not improved earnings quality in step. For a leader, the first problem is industry-wide. The second is a valuation problem.
R&D capitalization changes the earnings picture
Financial treatment also matters in this report. BYD has raised the share of R&D spending that it capitalizes this year. Under the earlier approach, profit would likely look weaker. Capitalization is not automatically wrong. R&D is large, project cycles are long, and some capitalization is reasonable. But a higher capitalization rate delays expense recognition and lifts current profit without changing cash spending. It affects earnings quality, not cash flow.
Do not look only at net profit. Track total R&D spending, the capitalization rate, amortization periods, operating cash flow, inventory, receivables, and contract liabilities. If the capitalization rate rises while R&D spending also grows quickly, discount the profit. If operating cash flow and contract liabilities weaken at the same time, the earnings quality problem is clearer. Accounting choices do not change competitiveness. They do change how the market prices profitability. Leaders already face tight scrutiny, and a shift in financial treatment gets read quickly.
Exports carry profit, and they are the biggest 2027 variable
BYD’s results have held up largely because exports are strong. Domestic retail is grim. Passenger car export data from the China Passenger Car Association tells a different story: 3.887 million vehicles in the first nine months, up 138.8% year on year. That export wave has offset weak domestic demand. BYD’s overseas revenue share above half and its higher overseas gross margin confirm the pattern. Profit comes from abroad. Domestic operations roughly break even.
Can that last? After Q3, the market’s attention moves to 2027. Exports are the current profit base and the biggest marginal variable for next year. A 138.8% export growth rate cannot repeat. The export tax rebate cut in April next year may pull demand into Q4 this year and Q1 next year. After that window, year-on-year growth likely fades. The question is how fast it fades and whether export gross margin holds. If overseas growth flattens, BYD’s earnings elasticity weakens, and the overseas growth premium in its valuation needs repricing.
There is also a cost problem inside the export story. Overseas markets bring competition, tariffs, local production, and channel investment. In a high-growth export phase, scale can absorb some of those costs. When growth slows, shipping, tariffs, currency, and channel expenses press harder on gross margin. Overseas gross margin will matter more than export volume growth.
Two questions for 2027
After Q3, two questions frame 2027.
First, what does the growth base look like? Consensus expects the domestic auto market to be flat or slightly better next year. NEV penetration is already high, so domestic demand will not provide excess growth. Overseas, the April rebate cut may create a pull-forward window in Q4 and Q1. After that, year-on-year growth likely normalizes. Overseas exports will not match 2026 strength. That removes a major source of earnings elasticity for BYD.
Second, will domestic competition improve? Major new EV makers mostly have enough cash. Seres has burned more cash than peers, but the others are not close to forced exits. Losses have not cleared the market. Domestic competition in 2027 will remain a red ocean. Product upgrades are unlikely to earn a clear price premium. BYD should not be expected to escape that pressure easily.
Put those two judgments together. BYD can plausibly keep double-digit sales growth in 2027. Holding per-vehicle profit will be much harder. Two tax issues next year add more pressure. Under that base case, the 2027 profit outlook is hard to revise upward. Valuation lacks a clear path to improvement. Share price pressure remains a real risk.
Leaders get punished, but expectations decide the stock
A cautious operating view does not automatically translate into a straight-line share price call. Markets punish leaders because leader valuations carry high expectations. When expectations fall, valuation compression can move faster than earnings. If the market has already priced in profit cuts and an export slowdown, and valuation is low, the stock may not fall in step with earnings. Expectations matter more than direction.
BYD’s core problem after Q3 is specific. Sales held. Earnings quality did not. Exports carry profit, and their marginal contribution will weaken next year. Domestic competition remains a red ocean. Product upgrades are unlikely to earn a premium. A higher R&D capitalization rate lowers the quality of reported profit. Under that mix, the 2027 profit outlook is hard to lift, and valuation has little room to improve. Downward pressure on the stock remains possible. The size of that pressure depends on how much pessimism is already in the price, and on whether export gross margin, domestic price competition, and spending produce surprises.
What to watch
First, break down the gross margin decline. Split it between domestic and overseas. Split it between price, cost, and mix. If overseas gross margin also weakens, the profit base is loosening. If domestic price competition is the only drag, exports still cushion the model.
Second, watch R&D capitalization and operating cash flow. A higher capitalization rate lifts current profit. Cash flow does not lie. Operating cash flow, inventory, receivables, and contract liabilities tell you more about earnings quality than one quarter of net profit.
Third, match export growth with export gross margin. The pull-forward window moves demand earlier. A year-on-year slowdown after the window is likely. Export gross margin matters more than the export growth rate.
Fourth, watch domestic competition and per-vehicle profit. New EV makers have enough cash, so pressure will not clear soon. If the domestic market stays a red ocean and product upgrades fail to earn a premium, per-vehicle profit will stay weak.
The Q3 report leaves BYD with a clear task: show that volume can carry margin again. Until it does, the stock will trade on expectations, and those expectations are lower than they were at the half-year report.
About the Creator
Jin
Writer of reamstories
https://reamstories.com/jin
Enjoyed the story? Support the Creator.
Subscribe for free to receive all their stories in your feed. You could also become a paid subscriber, letting them know you appreciate their work.
Comments
There are no comments for this story
Be the first to respond and start the conversation.