
Yield Curve Inversions and What It Could Mean for Your Portfolio
Fear. Panic. A Twitter tirade. Is all this talk about the yield curve justified hype or just hyperbole?


If you’ve been a follower of financial news you have been hearing about all this talk about the so-called yield curve. In fact, it was fears of a yield curve inversion that have sent the Dow and S&P 500 indices tumbling from their recent highs just before the New Year.
So, what exactly is the yield curve and how does its inversion affect my investments? Simply put, the yield curve refers specifically to the curve of US Treasuries across different contract lengths—you can view the current daily yield curve from the Treasury website here. A normal yield curve would have yields increasing as the time horizon increases; this makes sense as the longer the maturity of a bond, the higher the chance for events (e.g. issuer defaulting or interest rates rising) that may cause the value of the bond to decrease.
An inverted yield curve, however, would be the opposite. It would have yields decreasing as the time horizon increases which goes against that conventional wisdom. This means under this environment, you might be getting a higher rate of return on a 2-month T-bill compared with a 5-year Treasury Note!
At this point you might be thinking—that’s fine and dandy, but I’ll ask again, how does this affect my investments given I have no positions in treasuries? Well it is important to note whenever market abnormalities occur, it’s often a signal by the market that fundamentally something is wrong. Under an inverted yield curve scenario, investors are expecting negative economic events to occur in the near term that force the Fed to decrease interest rates, hiking the value of longer term bonds (since their rates are locked in far into the future) and decreasing the value of shorter term securities (since they need to be reinvested at a lower rate in the near future).
In fact, since its discovery in 1986 by professor Campbell Harvey, an inversion in the yield curve has predicted all three recessions since: 1991, 2000, and 2008 with no false signals! In fact, the model could be back-tested with 100 percent accuracy since the 1960s.
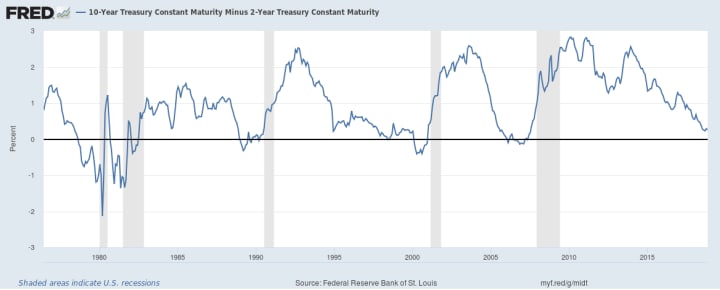
The spread between 2-year treasuries and 10-year treasuries—note that every time it goes negative a recession occurs shortly afterwards.
Alright I get it, it’s time to run for the hills and batten down the hatches… But wait! Others have argued that this time may be different, and that present circumstances are different than anything we’ve experienced in the past 70 years.
Well, what potentially might be different this time? Well for starters, the 2008 financial crisis was an unprecedented financial calamity not seen since the Great Depression of 1929, and actions taken by the Federal Reserve to alleviate the US economy out of its rut were equally unprecedented. After dropping interest rates to zero, the Fed in a further attempt to simulate the economy, began a program of Quantitative Easing or sometimes referred to as money printing. This saw the central bank purchase large swaths of securities from the market, including trillions of dollars’ worth of US debt.
Now with the economy back on its feet, the Fed has begun a policy of normal monetary policy by doing the exact opposite—hiking interest rates and offloading these debts and securities back onto the market. Many have argued that these recent actions are the primary reasons for a flattening yield curve and that central bank actions, not natural free-market forces, are contributing to the inversion. Furthermore, others have noted that outside of the US, yield curve inversion in other economies have been a far less reliable predictor of recessions.
So, what does this mean for the average investor? Are the concerns over the yield curve overblown? In my view, regardless of the yield curve, I do think the stock market has been overdue for a major correction. Going into 2019, investors, particularly those with shorter time horizons, need to ensure that their portfolios are adequately diversified into asset classes that have low correlation to the stock market—these include gold, investment grade corporate bonds, and yes, US Treasuries.
While predicting recessions is often described as a fool’s errand, getting ready for one isn’t.
About the Creator
Lester Lee
Your typical millennial stuck in a 9 to 5.
Keep reading
More stories from writers in Trader and other communities.
The Future of Algorithmic Trading and AI in Finance
In recent years, the financial industry has witnessed a rapid transformation driven by advancements in technology, particularly in the fields of algorithmic trading and artificial intelligence (AI). These technologies have revolutionized the way financial markets operate, providing new opportunities and challenges for traders, investors, and financial institutions alike. In this article, we will explore the future of algorithmic trading and AI in finance, examining the key trends, challenges, and opportunities that lie ahead.
By BLESSING COOL 4 days ago in Trader


Comments
There are no comments for this story
Be the first to respond and start the conversation.