investing
'Buy low, sell high' is just the tip of the iceberg; learn the art of investing from expert traders and how to make your money grow.
Advisor or AI? The 2025 Dilemma
Digital Morning Decision On a quiet Tuesday morning in May, Diane Wilkes sat at her kitchen table in Portland, Oregon, sipping her second cup of coffee while staring at her tablet. A notification blinked from her AI-powered investment platform:
By Time Money Codeabout a year ago in Trader
How to Tap into the Profit Potential of Crypto Exchanges
Why Crypto Exchanges Are a Strong Business Model Crypto exchanges serve as intermediaries that connect buyers and sellers of cryptocurrencies. Every time a trade takes place, the exchange earns a small fee, sometimes just a fraction of a percent. But with thousands of trades happening every day, these fees add up quickly.
By Michal steveabout a year ago in Trader
Fundamental vs Technical Analysis in Forex
Forex trading is a world of fast decisions, deep research, and sharp instincts. But to consistently succeed, every trader needs one powerful advantage: analysis. There are two primary methods traders use to make decisions: Fundamental Analysis and Technical Analysis. Each has its strengths, weaknesses, and dedicated followers — but which one is truly better for Forex in 2025? Let’s break down both approaches so you can understand how they work, what they offer, and how to decide which one fits your trading style. 🔍 What Is Fundamental Analysis? Fundamental analysis looks at the big picture. It focuses on economic, political, and financial factors that influence a country’s currency value. In short: if a country’s economy is strong, its currency usually gains strength. If the economy is weak or unstable, the currency may drop. 🏦 Key Factors in Fundamental Analysis: 1. Interest Rates – Higher rates attract investors → stronger currency 2. Inflation – Moderate inflation is good, but high inflation weakens a currency 3. GDP Growth – A growing economy supports a stronger currency 4. Unemployment Rates – Lower unemployment = economic strength 5. Geopolitical Events – Elections, wars, or policy changes can shake currency values 6. Central Bank Policies – Decisions by the Fed, ECB, BOJ, etc., directly affect Forex markets 🧠 Example: If the U.S. Federal Reserve raises interest rates, it often strengthens the USD. You might expect USD/JPY or EUR/USD to move in response. --- ✅ Pros of Fundamental Analysis: Provides long-term direction Helps you understand why the market moves Works well for position traders or swing traders ❌ Cons: Can be complex and requires daily news tracking Market may react irrationally or delayed Not always useful for short-term trades 📊 What Is Technical Analysis? Technical analysis focuses on price charts, patterns, and indicators. The idea is simple: history tends to repeat itself. Technical analysts believe that all fundamental information is already priced into the market, so they rely solely on chart behavior to predict future moves. 🔧 Key Tools in Technical Analysis: 1. Candlestick Patterns – e.g. Doji, Engulfing, Hammer 2. Support & Resistance Levels 3. Indicators – RSI, MACD, Moving Averages, Bollinger Bands 4. Trend Lines & Chart Patterns – Head and Shoulders, Flags, Triangles 5. Volume & Volatility Tools 🧠 Example: If EUR/USD forms a double bottom on a 1-hour chart with RSI below 30 (oversold), a trader might enter a long position expecting a bounce. --- ✅ Pros of Technical Analysis: Ideal for short-term trading (scalping, day trading) Fast, visual, and easy to automate Works well even without deep economic knowledge ❌ Cons: Can give false signals in low-volume or news-heavy markets Doesn’t explain why price is moving — only shows that it is Requires chart reading skill and practice ⚔️ Technical vs Fundamental: Which One Wins in 2025? There’s no one-size-fits-all answer. It depends on your trading style, goals, and personality. Here’s a quick comparison: Factor Fundamental Analysis Technical Analysis Focus Economic & political events Price charts & patterns Best for Long-term traders Short-term traders Complexity Higher – needs research Lower – more visual Speed Slower reaction Fast signals Strength Explains "why" the market moves Helps with timing and entry points Weakness Can lag in fast-moving markets Can give false signals 🔄 Why the Best Traders Combine Both The most successful traders in 2025 blend both methods. They: Use fundamentals to identify the big picture or bias (bullish/bearish) Use technical analysis to fine-tune their entry and exit points 📌 Example: If GBP/USD is in a strong uptrend due to positive UK interest rate news (fundamentals), a trader might wait for a pullback to support and enter on a bullish candlestick pattern (technicals). --- ✅ Final Verdict: Which Is Better? If you enjoy following news, reading reports, and understanding global economics → Start with Fundamental Analysis If you’re more visual, like charts, and prefer fast trades → Start with Technical Analysis But for maximum power, combine both. In Forex trading, knowledge is profit. The deeper your understanding, the more confident and accurate your decisions will become.
By Junaid Ali (Official)about a year ago in Trader
Exploring the Fintech Company Revolutionizing Finance
Once upon a time, financial transactions meant long queues at the bank, endless paperwork, and rigid bureaucracy. But today? A few taps on your phone and your money's moving across continents, investments are growing in real time, and your bank fits neatly into your pocket.
By Talha Mazharabout a year ago in Trader
Why Temu Got Expensive Overnight in Pakistan: Here's What Changed After July 1st
Temu is an online shopping app similar to Amazon, Alibaba, and AliExpress. Temu gained popularity worldwide by offering consumers low-cost products. This online shopping platform attracts users due to its extremely affordable pricing, as it follows a factory-to-consumer model—meaning there are no third parties or middlemen involved. The platform began operating in 2022. In addition to shoes, toys, clothing, and fashion items, it also features products that many people may not even know exist—some of which arguably shouldn't exist at all. Temu is one of the most downloaded shopping apps in Pakistan. Its popularity can be attributed to the following reasons: Low Prices: Temu offers products at reduced prices by shipping directly from China. Wide Product Range: The app features over 600 categories of items, including electronics, fashion, home goods, and cosmetics. Shipping and Perks: Temu currently offers free delivery, and if the delivery is not made within the specified time (usually 4–11 days), the customer receives a Rs. 280 credit. From Affordble to Overpriced: Why Temu Products Just Got a Lot More Expensive in Pakistan Looking for a budget-friendly CCTV camera, a stylish glass water bottle, or everyday makeup essentials? For many shoppers in Pakistan, the go-to answer has often been one word Temu. But as the calendar turned to July 1st, something changed. Prices on the popular online shopping platform spiked dramatically products that were previously selling for Rs. 500 are now listed for Rs. 1,500 to Rs. 2,000. Price Hike Shocks Customers The sharp rise in prices hasn’t gone unnoticed. Social media platforms are flooded with complaints, as users share screenshots of their old Temu purchases at far lower prices and express regret over not completing their orders earlier. Some shoppers blame themselves for missing out, while many others are pointing fingers at the government’s new tax policies, which came into effect with the 2024-25 federal budget. What Changed? Government Taxation Targets Foreign E-Commerce According to officials from the Federal Board of Revenue (FBR), the Pakistani government has rolled out the Digital Presence Proceeds Tax Act a policy aimed at taxing international e-commerce platforms that sell directly to Pakistani consumers. Under this new regulation, any product sold in Pakistan through foreign platforms like Temu, Amazon, AliExpress, or Alibaba now faces a 5% digital tax. The FBR explains that locally-made products already bear a heavy tax burden 18% sales tax and up to 35% income tax while international platforms were previously operating tax-free. This created an uneven playing field that hurt local manufacturers. To correct this imbalance, the government is now demanding that foreign sellers contribute similarly to the national tax base even though these companies don’t have physical offices in Pakistan, which is why income tax doesn’t apply to them directly. However, in addition to the 5% digital tax, an 18% sales tax is now applicable as well. Is Temu Also Raising Prices on Its Own? While taxes have clearly played a role, some customers and observers believe the story doesn’t end there. A price jump of up to 300% has led to speculation that Temu itself may have increased its rates, perhaps in response to the new policy or to maintain profit margins. Critics argue that even with new taxes, such a massive price surge isn't entirely justified. There's hope that prices could stabilize over time, though likely not to pre-July levels. Online Backlash: "We’re Being Punished for Wanting Quality The public reaction has ranged from frustration to humor. One user posted, “Temu's quality was never top-tier, but at least it was cheap. Now it’s just overpriced. Another remarked, The government seems to hate seeing us enjoy affordable products. Some users lamented the lack of innovation in local goods, arguing that raising taxes on international items won’t magically improve the quality of local offerings. One user noted, Temu filled a gap giving us access to trendy, affordable products from abroad. Now even that’s slipping away. And of course, there were light-hearted posts too. One read Just my luck Temu got expensive the before I placed my order.
By Real contentabout a year ago in Trader
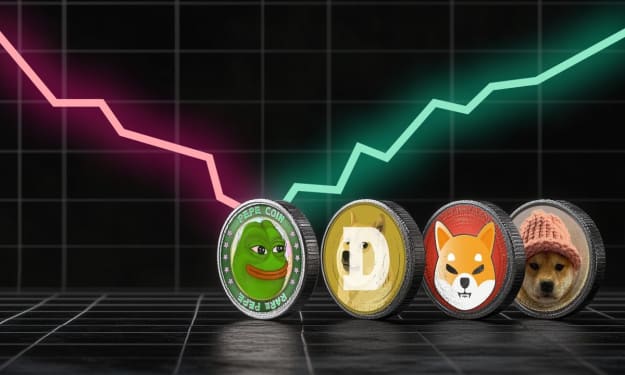
The Memecoin Phenomenon: Why Jokes Became a $70 Billion Investment Category . AI-Generated.
A cryptocurrency based on a dog meme once reached an $80 billion market cap. In 2025, platforms like Pump.fun launch 15,000+ new memecoins daily. What started as internet jokes now commands 27.1% of global crypto investor interest, outperforming many "serious" blockchain projects.
By Greg Lantonabout a year ago in Trader
Turn a Small Budget into Big Gains with Polymarket Clone Script
Introduction In today’s fast-moving blockchain and cryptocurrency world, prediction markets have become a game-changer for entrepreneurs looking to enter the crypto space. Platforms like Polymarket have gained massive popularity by allowing users to bet on real-world events using cryptocurrency..
By smithtaylorabout a year ago in Trader
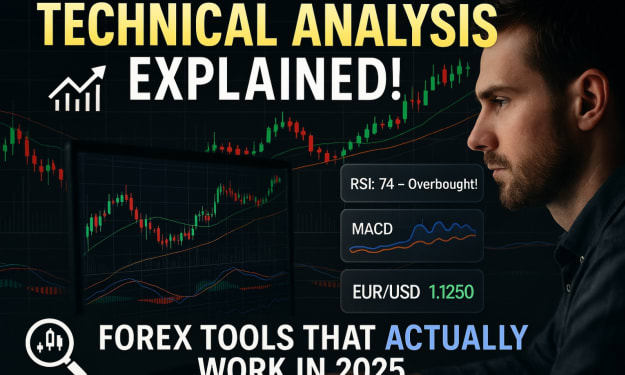
How to Use Technical Analysis in Forex Trading
In the fast-paced world of Forex trading, one of the most powerful tools in a trader’s toolbox is technical analysis. Unlike fundamental analysis, which focuses on news and economic data, technical analysis uses charts, indicators, and patterns to predict future price movements based on historical behavior. If you're new to Forex or still relying on luck and gut feeling, this guide will show you how to start reading the charts and trading with confidence using technical analysis. 🧠 What is Technical Analysis? Technical analysis is the study of price action, chart patterns, and indicators to forecast where the market is likely to move next. It’s based on the idea that all current market information is already reflected in the price. In other words: “History repeats itself” — and patterns often return under similar conditions. This approach is widely used by day traders, swing traders, and even automated bots, and in 2025, it remains the backbone of short-term and mid-term Forex strategies. 📊 Key Tools of Technical Analysis Here are the most commonly used tools and how they help in decision-making: --- 📈 1. Candlestick Charts Candlesticks show price movement over a specific time period (e.g., 1 minute, 1 hour, 1 day). Each candlestick includes: Open High Low Close Some key candlestick patterns include: Doji – indecision in the market Engulfing Pattern – strong reversal signal Hammer / Shooting Star – trend reversal ✅ Use It For: Spotting momentum, reversals, or continuation patterns. 🧭 2. Support and Resistance These are key price levels where the market often reverses or stalls. Support = Price floor (buyers step in) Resistance = Price ceiling (sellers step in) If price breaks resistance, it may continue up. If it breaks support, it may fall further. ✅ Use It For: Entry/exit points, placing stop-loss and take-profit zones. 📉 3. Moving Averages (MA) These smooth out price data to identify trends over time. Simple Moving Average (SMA) – average price over a set number of periods Exponential Moving Average (EMA) – gives more weight to recent prices Common strategies include: Golden Cross – Short MA crosses above long MA (bullish signal) Death Cross – Short MA crosses below long MA (bearish signal) ✅ Use It For: Trend direction and confirmation. ⚡ 4. Relative Strength Index (RSI) RSI is a momentum indicator that ranges from 0 to 100. Above 70 = Overbought (potential reversal down) Below 30 = Oversold (potential reversal up) ✅ Use It For: Spotting possible reversals and trade entry points. 🔄 5. MACD (Moving Average Convergence Divergence) A momentum indicator showing the relationship between two EMAs. It consists of: MACD Line Signal Line Histogram A MACD crossover can signal a buy or sell opportunity. ✅ Use It For: Trend strength and direction. 🧪 Combining Indicators for Better Accuracy Pro traders never rely on just one indicator. They often combine multiple tools for stronger confirmation. 📌 Example Strategy: Use Moving Averages to identify the trend Use RSI to find overbought/oversold signals Use Support/Resistance to plan your entry and stop-loss This triple-confirmation method reduces false signals and increases success probability. 📘 Real-Life Forex Trade Example (EUR/USD) Let’s say EUR/USD is trending upward: You plot 50 EMA and see price staying above it (bullish trend) RSI is at 35 (not overbought) Price bounces off a known support level ✅ This could be a buy signal — enter long with a stop-loss below support and a target at the next resistance level. ⚠️ Common Mistakes to Avoid Overloading your chart with indicators – Keep it simple, 2-3 tools max. Ignoring the overall trend – Don’t trade against the trend. Using indicators without understanding them – Know what they measure and how they behave. Not using a stop-loss – Always protect your capital. 🧭 Tips for Technical Analysis in 2025 Use multi-timeframe analysis: check trends on 1H, 4H, and Daily Practice with a demo account before going live Stay updated with AI-enhanced trading tools now integrated in platforms like TradingView, MetaTrader 5, and Exness Combine technical + fundamental analysis for maximum confidence ✅ Final Thoughts Technical analysis gives traders the ability to read the market visually, spot opportunities, and make informed decisions. In a market where prices move fast, being able to analyze charts quickly and accurately is a competitive advantage. If you’re serious about Forex trading, mastering these tools is non-negotiable. Start slow, stay consistent, and refine your skills with practice.
By Junaid Ali (Official)about a year ago in Trader
Understanding Currency Pairs
If you're stepping into the world of Forex trading, one of the first things you’ll come across is currency pairs—the foundation of all your trades. Understanding how they work is essential to make smart decisions and read the market like a pro. In this article, we’ll break down what currency pairs are, how to interpret them, and how to analyze them using both technical and fundamental approaches in 2025’s evolving market. 💱 What Are Currency Pairs? In the Forex market, you trade one currency against another. That’s why every trade involves a pair—like EUR/USD or GBP/JPY. Each pair consists of: Base Currency: The first currency listed (e.g., EUR in EUR/USD) Quote Currency: The second currency listed (e.g., USD in EUR/USD) When you see EUR/USD = 1.1200, it means 1 Euro equals 1.12 US Dollars. If the number goes higher, the Euro is getting stronger. If it drops, the Dollar is gaining strength. --- 🔍 Types of Currency Pairs There are three main types of currency pairs: ✅ 1. Major Pairs These include the most traded currencies in the world and always involve the US Dollar. Examples: EUR/USD USD/JPY GBP/USD USD/CHF These pairs are popular because they’re liquid, stable, and have low spreads. ⚠️ 2. Minor Pairs (Cross Pairs) These don’t involve the US Dollar but still include major currencies like EUR, GBP, or JPY. Examples: EUR/GBP AUD/NZD GBP/JPY These can have higher volatility and spreads but offer interesting opportunities. 🌍 3. Exotic Pairs These pair a major currency with a lesser-traded or emerging-market currency, such as: USD/TRY (Turkish Lira) EUR/ZAR (South African Rand) USD/PKR (Pakistani Rupee) Exotic pairs are high-risk, high-reward, and often influenced by political or economic instability. 📈 How to Analyze Currency Pairs Like a Pro To trade successfully, you need to understand why a currency pair moves, and where it's likely to go next. That’s where analysis comes in. --- 🧠 1. Fundamental Analysis This focuses on the real-world economic and political factors that influence currencies. Key Factors: Interest Rates (Central bank decisions like the Fed or ECB) GDP Growth Unemployment Rates Inflation Political News (elections, wars, instability) 💡 Example: If the U.S. Federal Reserve increases interest rates, USD tends to strengthen, affecting pairs like EUR/USD or USD/JPY. ✅ Pro Tip: Check an economic calendar daily. Websites like ForexFactory or Investing.com show upcoming events that could impact your trades. --- 📊 2. Technical Analysis This is the art of using price charts, indicators, and patterns to predict future movement. Common Tools: Candlestick Patterns (Doji, Engulfing, Hammer) Support and Resistance Zones Moving Averages (MA, EMA) Indicators like RSI, MACD, Bollinger Bands 💡 Example: If EUR/USD breaks above a resistance level and volume supports the move, it could be a signal to buy. ✅ Pro Tip: Combine multiple indicators for confirmation. Don’t rely on one tool alone. 🔁 Correlation Between Pairs Some currency pairs move in the same direction, while others move oppositely. Positive Correlation: EUR/USD and GBP/USD often rise and fall together. Negative Correlation: EUR/USD and USD/CHF often move in opposite directions. Knowing these relationships helps manage risk and avoid taking trades that cancel each other out. 💬 How to Choose Which Pairs to Trade As a beginner, start with major pairs like EUR/USD or USD/JPY. They are less volatile, more liquid, and easier to analyze. As you gain experience, explore minors and exotics. Ask yourself: Do I understand what drives this pair? Does my strategy work well with its volatility? Can I handle the drawdowns and spreads? ✅ Final Thoughts Understanding currency pairs is the first step to becoming a successful Forex trader. By mastering how to read, interpret, and analyze them, you gain the power to make informed decisions—not emotional guesses. Forex trading isn’t just clicking “Buy” or “Sell.” It’s about knowing what you’re trading, why it moves, and what to expect next. Take the time to study the pairs, track their behaviors, and keep learning. In 2025 and beyond, informed traders are the ones who win.
By Junaid Ali (Official)about a year ago in Trader
Top 10 Mistakes New Forex Traders Make
The Forex market is full of opportunity, but also full of traps for new traders. With high leverage, real-time global news impact, and psychological pressure, many beginners dive in unprepared and end up losing money fast. If you're starting out in Forex trading in 2025, knowing what mistakes to avoid can save your capital—and your confidence.
By Junaid Ali (Official)about a year ago in Trader
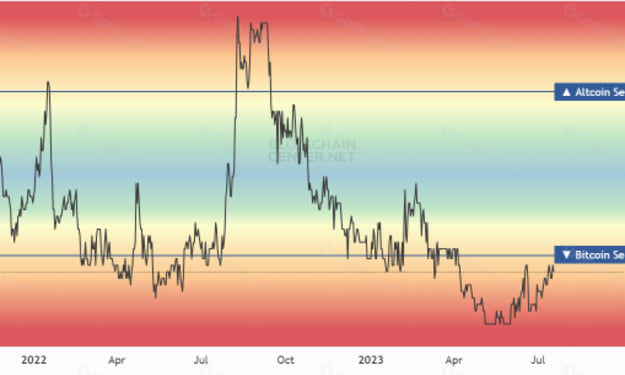
Decoding the Altcoin Season Index: Your Guide to Crypto Market Cycles . AI-Generated.
The cryptocurrency market moves in distinct cycles, alternating between periods where Bitcoin dominates and phases where alternative cryptocurrencies (altcoins) take center stage. For traders and investors, understanding these cycles can mean the difference between catching massive gains and missing out on some of the most profitable opportunities in crypto.
By Greg Lantonabout a year ago in Trader