
Simple Non-Repaint Strategy for New Traders
I lost $4,000 in a single week chasing 'perfect' indicator signals that disappeared the moment I clicked buy. If you are tired of the 'repaint' trap, this raw, simple strategy is your way out.

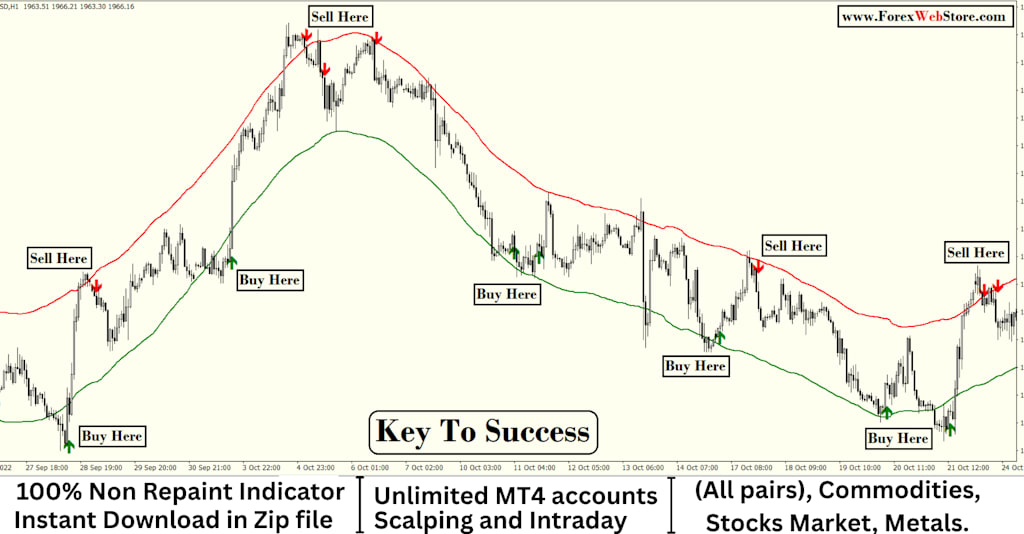
Stop Chasing Ghosts: The Brutally Honest Non-Repaint Strategy That Saved My Trading Career
I lost $4,000 in a single week chasing 'perfect' indicator signals that disappeared the moment I clicked buy. If you are tired of the 'repaint' trap, this raw, simple strategy is your way out.
The Day I Realized My Indicators Were Lying to Me
I remember sitting in my darkened home office at 3:00 AM, the blue light of three monitors burning into my retinas. I had just taken what looked like the perfect trade. A bright green arrow had appeared on my screen, signaling a massive 'Buy' opportunity. I went in heavy. Two minutes later, the price tanked. I looked back at the chart, and the green arrow was gone. It didn't just point the wrong way; it literally vanished into thin air.
That was my introduction to 'repainting.' It is the most disgusting, dishonest trick in the trading world. Most 'guru' indicators look back at historical data and place signals where they should have been, rather than where they actually occurred in real-time. It makes the indicator look like it has a 90% win rate on a static chart, but when you actually try to trade it? You get slaughtered.
I almost quit. Honestly, I should have. But instead, I stripped everything away. I realized that if I wanted to win, I needed a simple non-repaint strategy that relied on cold, hard price data—not some laggy algorithm trying to predict the future.
Why Most New Traders Get Mauled
Look, the retail trading world is designed to take your money. You are up against high-frequency algorithms and institutional banks. If you are using a 14-period RSI and a couple of moving average crossovers, you are bringing a butter knife to a nuclear silo. But the biggest enemy isn't the banks; it’s the complexity.
We think more indicators equal more safety. It’s the opposite. It’s analysis paralysis. I spent months adding more 'filters' to my charts until I couldn't even see the price candles anymore. The secret to a successful day trading for beginners approach isn't more data; it's better data. You need signals that stay put. Once a candle closes, the signal must be permanent. That is the only way to build a backtest you can actually trust.
Step 1: The Anchor (Moving Average as a Filter)
We are going to use one—and only one—moving average. I prefer the 200-period Exponential Moving Average (EMA). Why? Because the entire world looks at it. It’s a self-fulfilling prophecy.
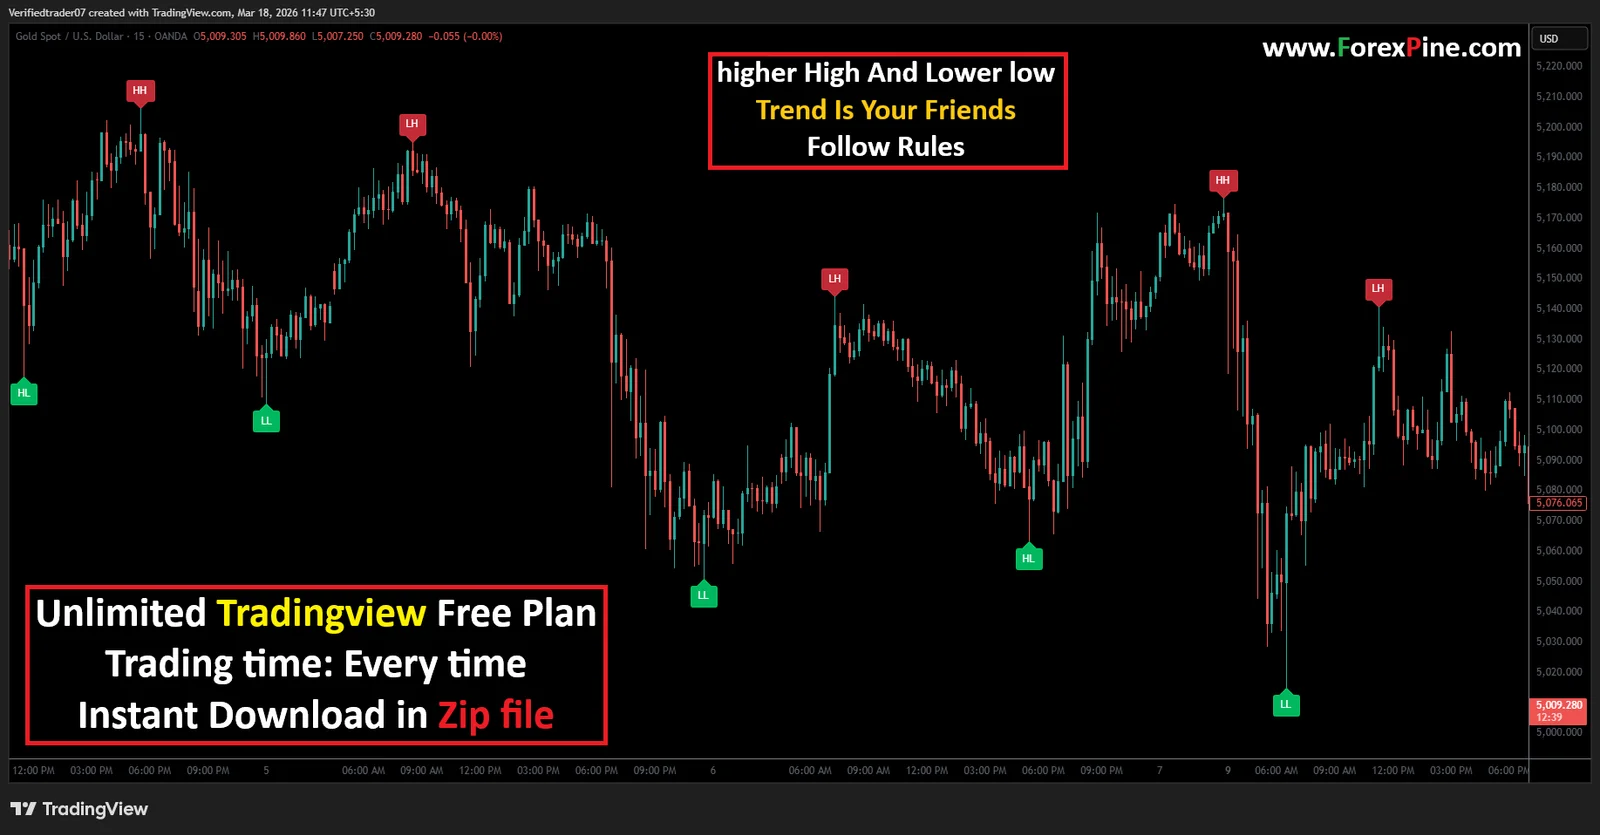
In this simple trading system, the 200 EMA is our compass. If the price is above it, we only look for buys. If it is below, we only look for sells. Period. No exceptions. This one rule alone will stop you from 'fighting the trend,' which is where 70% of new traders lose their entire accounts. It’s not about catching the exact bottom; it’s about riding the wave that’s already moving.
Step 2: Finding the 'Wall' (Support and Resistance)
Indicators might lie, but price levels don't. I stopped looking for fancy 'harmonic patterns' and started looking for basic price action basics. I look for areas where the price hit a ceiling and crashed, or hit a floor and bounced.
I call these 'The Walls.' When price approaches a previous 'Wall' that aligns with our 200 EMA direction, my heart rate starts to climb. That is where the money is made. You don't need a $500 custom indicator to find these. Use your eyes. Look for where the price got rejected violently in the past. Those levels have 'memory.'
Step 3: The Trigger (The Non-Repaint Entry)
This is the crucial part. We need a signal that doesn't move. I use the 'Engulfing Candle' or a 'Pin Bar' at my identified levels.
Think about it. A Pin Bar shows a massive rejection. It means the big players stepped in and pushed the price back. When that candle closes, it is permanent. It won't disappear five minutes later. This is the core of a profitable trading habit. You wait for the close. If the candle doesn't look right at the close, there is no trade.
I used to jump in mid-candle because I was afraid of missing out (FOMO). That is a death sentence. Wait for the confirmation. The market isn't going anywhere.
The Math That Makes It Work
You can have a 40% win rate and still get rich. Read that again.
Most newbies think they need to be right all the time. I'm telling you, I’m wrong a lot. But when I’m wrong, I lose 1%. When I’m right, I make 3%. This is the swing trading guide secret: Risk-to-Reward ratio.
If you take 10 trades and lose 6, but your wins are triple the size of your losses, you are still significantly in the green. Most people fail because they let their losses run, hoping they’ll 'come back,' while cutting their winners short because they are scared the profit will evaporate. Flip that script. Be a cold-blooded assassin with your stop losses and a greedy pig with your take profits.
Why This Works When Others Fail
This strategy works because it respects the reality of the market. It doesn't rely on 'magic' or 'black box' software. It’s based on forex signals that are visible to everyone: trend, level, and rejection.
It’s boring. Trading should be boring. If your heart is racing every time you take a trade, you are gambling, not trading. By using a non-repaint trading strategy, you remove the uncertainty of the tools themselves. You know that if you lose, it wasn't because the chart lied to you; it was because the market simply chose a different path. And that? That is a pill you can actually swallow.
Moving Forward: Your 30-Day Challenge
Don't take my word for it. In fact, don't trust anyone in this industry blindly.
Open a demo account. Set up your 200 EMA. Identify your 'Walls.' Wait for those permanent candle triggers. Do this 20 times. Don't change the rules. Don't 'feel' the market. Just follow the system.
You’ll find that the stress starts to melt away. You aren't chasing ghosts anymore. You are waiting for your setup like a predator. This is the transition from a 'retail victim' to a disciplined trader. It took me years of pain to realize that the 'Holy Grail' isn't a secret indicator—it's a simple, repeatable process that stays the same even when the market gets crazy.
About the Creator
Pooja Verma
Forexwebstore.com Discover the Best Forex Indicators for a Simple Strateg. This page features key technical indicators for the most popular currency pairs in real time.
Enjoyed the story? Support the Creator.
Subscribe for free to receive all their stories in your feed.
Comments
There are no comments for this story
Be the first to respond and start the conversation.