
Multi-Timeframe Non-Repaint Trading Strategy Explained
I spent years getting fooled by indicators that lied to my face. Then I realized the secret wasn't more indicators, it was a shift in perspective. This is the raw truth about non-repaint trading.

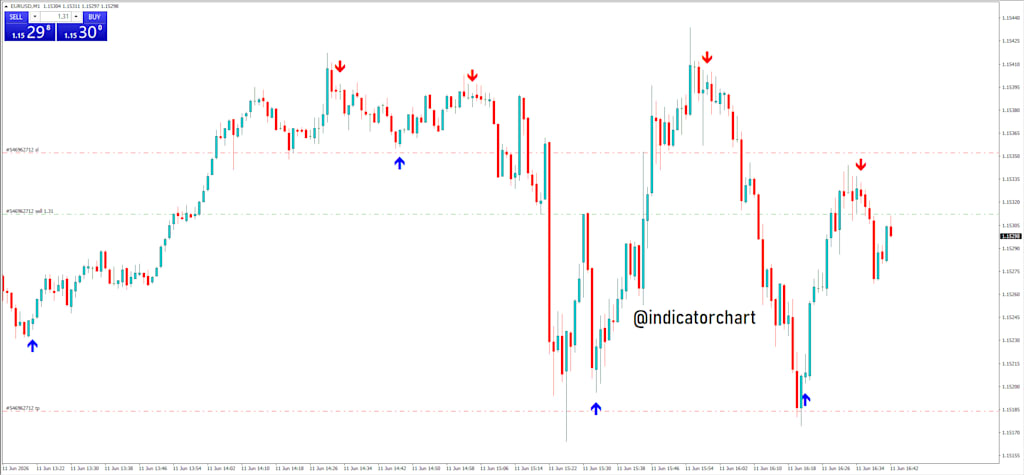
I Was Chasing Phantoms: The Multi-Timeframe Non-Repaint Strategy That Saved My Portfolio
I spent years getting fooled by indicators that lied to my face. Then I realized the secret wasn't more indicators, it was a shift in perspective. This is the raw truth about non-repaint trading.
I remember the exact moment I almost smashed my monitor. It was a Tuesday. I had just entered a 'perfect' buy trade based on a bright green arrow that appeared on my MT4 chart. The setup looked like a masterpiece. Five minutes later, the price tanked. I looked back at the chart, and the green arrow? It was gone. It had vanished into thin air, as if it never existed. That was my introduction to the toxic world of repainting indicators. It felt like being gaslit by a piece of software. If you've been trading for more than a week, you've probably felt that same gut-punch. You see a strategy that looks 100% accurate in the past, but the moment you trade it live, it falls apart.
The Lethal Trap of Repainting Indicators
Let's get real for a second. Most 'magical' trading systems sold on YouTube are garbage. Why? Because they repaint. A repainting indicator changes its past signals to match the current price action. It makes the creator look like a genius because every signal on the historical chart is a winner. But in the live market? It’s a death trap. You can't trade a ghost. You need something that sticks. That's why I became obsessed with finding a non-repaint trading strategy. I needed to know that if a signal appeared, it was staying there, win or lose. Transparency is the only way to build a real edge. Without it, you're just gambling with a UI that's lying to you.
Why Multi-Timeframe Analysis Is Your Only Edge
But here’s the thing. Even a non-repainting indicator can fail if you're looking at the market through a straw. If you only trade the 5-minute chart, you're a leaf in a hurricane. You might see a 'buy' signal, but you're actually buying right into a massive 4-hour resistance zone. You get crushed, not because the indicator was wrong, but because your perspective was too small. This is where multi-timeframe (MTF) analysis comes in. Think of it like a zoom lens. You start with the big picture to see where the tide is going, then you zoom in to find the perfect wave to surf. It sounds simple, but most people skip the big picture because they’re too impatient to wait for the H4 candle to close. Don't be that person.
The 'Big Brother' Perspective: Finding the Trend
In my system, I call the higher timeframe 'Big Brother.' If Big Brother is angry (trending down), we don't try to be a hero and buy. We look at the Daily or H4 charts first. This isn't just about drawing lines; it's about understanding market sentiment. Are the big banks moving money? Is there a structural shift? We use a non-repainting trend filter—something like a high-period smoothed moving average or a Donchian channel—to determine the 'Master Trend.' If the H4 is bearish, we are only looking for sell setups on the lower timeframes. Period. No exceptions. This one rule alone will save you from 70% of your losing trades.
The 'Sniper' Execution: The Lower Timeframe Entry
Once we know the direction, we drop down to the M15 or M5. This is where the technical analysis gets surgical. We’re looking for a confluence of factors. We want our non-repaint entry indicator to align with the higher timeframe trend. Imagine the H4 is pointing down, and now the M15 produces a rock-solid, non-repainting 'Sell' signal at a level of previous structure. That is the sweet spot. You’re not just guessing; you’re trading with the momentum of the entire market behind you. It's the difference between swimming against a current and riding a jet stream.
Building the Non-Repaint Toolkit
You don't need a thousand tools. You need three that work. First, a structural anchor. This could be simple horizontal Support and Resistance or Pivot Points. Second, a momentum oscillator that doesn't lag or repaint—think of a modified RSI or a Stochastic that waits for candle closes. Third, and most importantly, a volatility filter. The market moves in cycles of expansion and contraction. You want to enter when volatility is starting to expand. Look for an ATR (Average True Range) breakout. If the market is flat and 'choppy,' stay out. Cash is a position, too.
The Psychology of Trusting the Signal
Now, here is the hard part. Even with a profitable trading system, most people fail. Why? Because they don't trust the non-repaint signals. When a signal stays on the chart after a loss, it hurts. It’s right there, staring at you. People hate seeing their failures, so they go back to repainting indicators that hide the losses. It’s a psychological trick. To win, you have to embrace the losses. A non-repaint strategy gives you an honest look at your win rate. If your win rate is 60%, you have to be okay with that 40% of red. You have to take every single signal that fits your criteria without hesitation. Consistency is the bridge between a strategy and a career.
Putting It All Together: Your Trading Protocol
So, how do you actually execute this tomorrow morning? You sit down, you open your H4 chart, and you mark the bias. You move to the M15 and wait. You don't hunt for trades; you let the trades come to you. If the non-repainting indicators don't align with the 'Big Brother' trend, you go for a walk. You close the laptop. The market will be there tomorrow. The goal isn't to trade; the goal is to protect your capital until the high-probability setup arrives. This day trading secret isn't about some hidden code; it's about the discipline to follow a multi-timeframe logic without letting your ego get in the way. Stop chasing the phantoms of repainting arrows. Start trading the reality of the price action. Your bank account will thank you later.
About the Creator
Alex John
Today I will share with you how to trade option trading. Although this indicator is made for Stock Market, Forex Market if you work in other pairs then you can use it. Like:- Nifty, Banknifty, XAUUSD, EURUSD, USDCAD, EURCHF, GBPUSD,etc.
Enjoyed the story? Support the Creator.
Subscribe for free to receive all their stories in your feed.
Comments
There are no comments for this story
Be the first to respond and start the conversation.