
Elliott Wave Theory for Forex Markets
Elliott Wave Theory
Introduction:
Ralph Nelson Elliot developed the Elliott Wave in 1930. It is a type of technical analysis. The theory tends to break down fluctuations in the market into repetitive patterns by a progression of waves. This theory was inspired by the waves in the sea. Elliot uses sea waves to describe the financial markets. Waves can also define price movements and consumer behaviour. In 1900, Thoriest tried to connect nature to market behaviour, but only Elliot was successful. The theory was named biomimicry, which was the basis for wave theory. The theory got famous in 1935 when Elliot predicted a market bottom. Some consider Elliot as the worthy successor of Charles Dow. Elliot has given a precise definition for every market phase and confirmed the theory of Charles Dow.
The Principle:
The phenomenon is driven by economic flows, psychological currents and controlled by the laws of nature. If these were missing, then there would be no balance, and drastic fluctuations in the market will occur. The phenomenon is made and used by humans. That's why it is filled with the irrational behaviour of humans. The movement of price results from human activity; therefore, based on nature rules, it shows bearish and bullish trends that reoccur in the market. These recurring trends can be used to form a general model. The wave pattern relates to human psychology in Elliot theory. Their mood creates patterns that alter between optimism and pessimism. Elliott added elements for forecasting that can identify trends and calculate achievable price levels. Elliot waves theory is similar to Charles Dow Theory because both define the price movements in waves. Elliot gives stress on observing nature to grasp the basic trading cycles.
Types of Elliott Wave Theory:
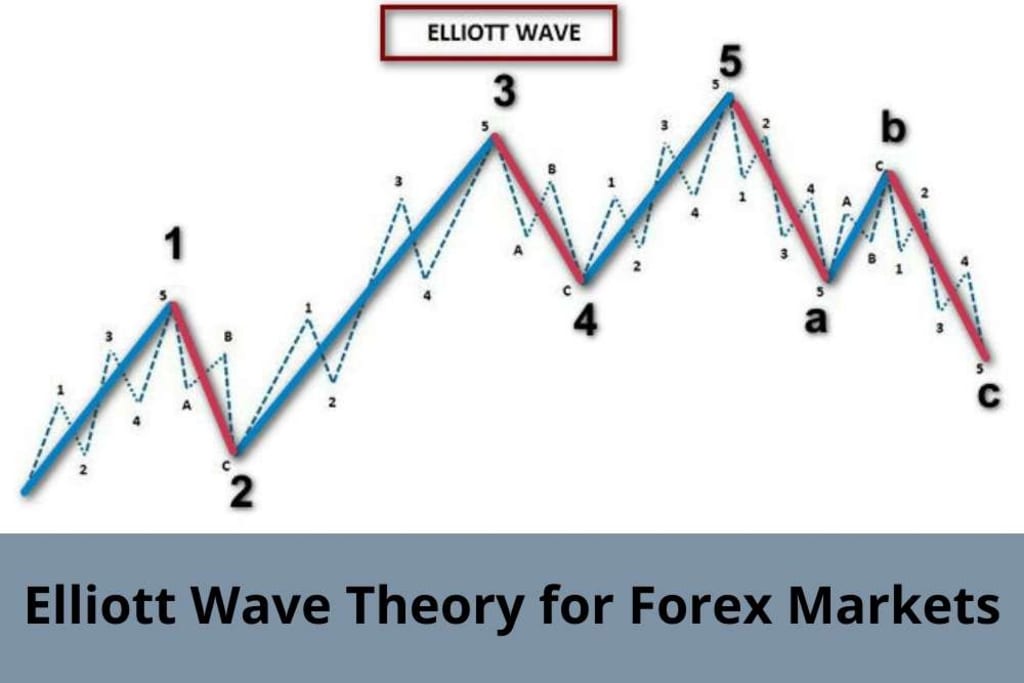
Elliott wave theory is the most popular technical analysis tool in the forex and other financial markets. It is beneficial for you. Suppose you can understand the Elliot theory and its variation because it is one of the most effective ṭechnical analysis tools to date. There are 2 types of waves in the Elliot theory, Impulsive and corrective waves. The impulsive wave is a structure with 5 waves, and the corrective way is a structure with 3 waves. Thus, there are 8 waves in the basic structure. The first 5 waves create impulsive or upward movement, and 3 sub-waves create corrective movement. There are endless cycles where there is one cycle of short duration. There are 34 cycles in the complete cycle, and each wave is divided based on the basic cycle. Waves moving with the trend are called impulse waves, and waves moving against the trend are called corrective waves.
Impulsive Wave
According to Elliott wave theory, the market moves in a 5-3 pattern. The repetitive pattern comprises 8 waves regardless of the market being bullish or bearish. The waves that move in a trend direction are called impulsive waves. These are the first 5 waves. There is a significant price move in the impulse waves, and two impulse waves are shorter than one. It's the third wave, usually as masses increase the price.
Wave 1 is the increase in initial price as people buy the stock at a low price.
Wave 2 is reversed because prices fall as people gain profit.
Waves 3 is an increase in price because masses decide to trade.
Wave 4 is people make a profit out of it as the price of the instrument increase.
Wave 5 is some bullish traders purchasing an overpriced instrument.
Corrective Waves
Corrective waves are three waves that come after the 5 waves. These waves are moving in the opposite direction of the impulse waves. It will rise and fall according to the bearish and bullish trend. Enough though these waves are not identifiable like impulse waves, there are 3 types of chart formation:
Zigzag
When waves are in a zigzag formation, the second wave is the shortest.
Flat:
It is the most straightforward formation as the length of each wave will be the same. There will be a sideway pattern for wave 1 as it will correct the impulse wave.
Triangle:
5 Sub waves create this formation. Each side is divided into 3 sub-waves which makes it a 3-3-3-3-3 structure. The wave is a combination of both flat and zigzag patterns; that's why it is complex. There are converging, and diverging trend lines in this pattern, and these lines are moving sideways. Triangle represents low volatility and volume. When there is a strong price movement, Top and bottom trend lines will peak.
It is more unpredictable than others because it can be increasing, decreasing, expanding, and symmetrical.
Conclusion:
Elliott wave theory relates the investor sentiments to the wave in price charts. There are two types of waves: impulsive and corrective waves; impulsive waves move with the trend, and corrective moves against the trend. The theory is inspired by nature, and it helps in reading the recurring patterns in the price charts. It helps in setting the stop loss as traders can find out where prices will rise and fall. This theory also helps find out profitable entry and exit points in the market, and it helps make trading decisions.
About the Creator
Sophia1212
https://trendingbroker.com/
Keep reading
More stories from Sophia1212 and writers in Trader and other communities.
What is GBP USD FX trading, and How to trade GBP USD?
What is GBP USD FX trading, and How to trade GBP USD? GBP/USD forex trading is the way of using the ending for purchasing the previous. In simple words, you are trading USD in against GBP, more respectively, creating the value of GBP in against USD. Do you know why we do that? Well, because the rates of both currencies are often fluctuating. Your target must be traded at the best rate comparatively from the previous rate (starting rate). The method in which GBP/USD FX trading works is to grab the other side of the coin.
By Sophia12123 years ago in Trader
Integrated marketing
Integrated Marketing Dispatches( IMC) is a strategic approach that ensures all marketing dispatches are cohesive, harmonious, and work together to support a brand's communication across colorful channels. In moment's dynamic and connected business, where consumers are bombarded with information from multiple sources, IMC has come essential for companies to effectively reach their target followership and achieve their marketing objects. At its core, IMC involves the integration of colorful communication tools, similar as advertising, public relations, direct marketing, deals creation, and digital marketing, to deliver a unified communication to consumers. By coordinating these rudiments, companies can produce a flawless brand experience that resonates with consumers and drives engagement and fidelity. One of the crucial benefits of IMC is that it allows companies to maximize the impact of their marketing sweats by using the strengths of each communication tool. For illustration, while advertising helps make brand mindfulness on a large scale, public relations can enhance credibility and trust by securing positive media content. Meanwhile, direct marketing enables substantiated communication with individual guests, while digital marketing offers precise targeting and real- time engagement openings. also, IMC enables companies to maintain thickness in their messaging across different channels, which is pivotal for erecting brand identity and recognition. harmonious branding helps consumers develop a clear understanding of what a brand stands for and fosters trust and fidelity over time. Whether a consumer encounters a brand's communication on social media, TV, or in- store, they should admit a harmonious communication that reflects the brand's values and positioning. Another advantage of IMC is its capability to produce community among colorful marketing channels, performing in a accretive effect that amplifies the overall impact of the crusade. When different communication tools are strategically integrated, they support each other, creating a more important and memorable brand experience for consumers. For illustration, a company may launch a TV announcement crusade to make mindfulness, rounded by social media elevations to encourage engagement and drive business to the website. By coordinating these sweats, the company can induce lesser brand visibility and engagement than if each channel were used singly. In addition to enhancing brand mindfulness and engagement, IMC also facilitates better dimension and evaluation of marketing effectiveness. By integrating different communication tools, companies can track the performance of each channel and assess how they contribute to overall crusade objects. This allows marketers to optimize their strategies in real- time, allocating coffers to the most effective channels and refining messaging to more reverberate with their target followership. still, enforcing IMC effectively requires careful planning, collaboration, and collaboration across different departments and stakeholders within an association. It involves aligning marketing objects, messaging, and creative means across colorful channels while icing thickness in brand positioning and identity. This frequently requires breaking down silos between departments similar as marketing, advertising, public relations, and deals to foster collaboration and integration. also, with the rapid-fire elaboration of technology and the proliferation of new communication channels, the geography of IMC is constantly evolving. Companies must stay nimble and acclimatize their strategies to influence arising trends and technologies to stay applicable and competitive. From social media and influencer marketing to immersive gests and stoked reality, there are endless openings for brands to engage with consumers in innovative ways and produce memorable brand gests . In conclusion, Integrated Marketing Dispatches is a strategic approach that integrates colorful communication tools to deliver a cohesive and harmonious brand communication across multiple channels. By coordinating sweats across advertising, public relations, direct marketing, deals creation, and digital marketing, companies can maximize the impact of their marketing sweats, enhance brand mindfulness and engagement, and drive business results. still, successful perpetration requires careful planning, collaboration, and adaption to evolving consumer trends and technologies.
By vinoth kumar8 days ago in Trader
All about the iphone 13 (128GB) — Midnight
In the changing world of technology few announcements create much buzz and excitement as the reveal of a new iPhone. Every year Apples top tier smartphone captures attention with its design, cutting edge features and user friendly interface. The debut of the iPhone 13 has stirred up curiosity and speculation amidst expectations. Apples commitment, to pushing boundaries in innovation is evident in the promises of the iPhone 13 to redefine possibilities in technology. With improvements in design, performance and functionalities the iPhone 13 is set to impress consumers and establish benchmarks for excellence in the smartphone market. Lets explore what sets the iPhone 13 apart and dive into the features that have sparked enthusiasm among both tech enthusiasts and everyday users.
By The Article On "purchases & services"3 days ago in Trader
Talented Black creators spotlight: Catherine Nyomenda (Chap 3).
Catherine reminds me of an enigma wrapped within a riddle. When she writes, she skips between the poetic and the dramatic. Her highlights of the African lifestyles of herself, of authors whom she admires, and the many nuances of love keeps you wondering and pondering the passage of life.
By Novel Allen3 days ago in Chapters


Comments
There are no comments for this story
Be the first to respond and start the conversation.