
Crypto Market Analysis for September 27
Crypto Market Analysis for September 27

Bitcoin (BTC/USDT)
The market is in the uptrend on the Daily timeframe. The correction came to an end on September 26 and the pullback buying opportunity was formed.
The first target in the upward movement is the resistance level formed on September 11 – 13 with the borders of $22,355 – $22,780.
In case of successful development of the trend, a more distant target will be on the highs of August 12 – 15, where the next resistance is located with the borders of $24,500 – $25,210.
Long positions will remain relevant until the market is above the nearest support level on the Daily timeframe. The borders of this support are $18,635 – $18,840.

Bitcoin / U.S. Dollar. Daily price chart. Technical analysis.
Axie Infinity (AXS/USDT)
The resistance level was broken on the Daily timeframe on September 23, the trend is bullish. The correction came to an end on September 26 and the pullback buying opportunity was formed.
The highs of September 23 – 125 will be the target for the bullish movement. It is the resistance level with the borders of $13.16 – $13.70.
In case of successful development of the trend, a more distant target will be on the highs of September 9 – 12, where the next resistance is located with the borders of $14.75 – $15.40.
Long positions will remain relevant until the market is above the nearest support level on the Daily chart, the lows of September 21 – 23. The borders of this support are $11.65 – $11.79.
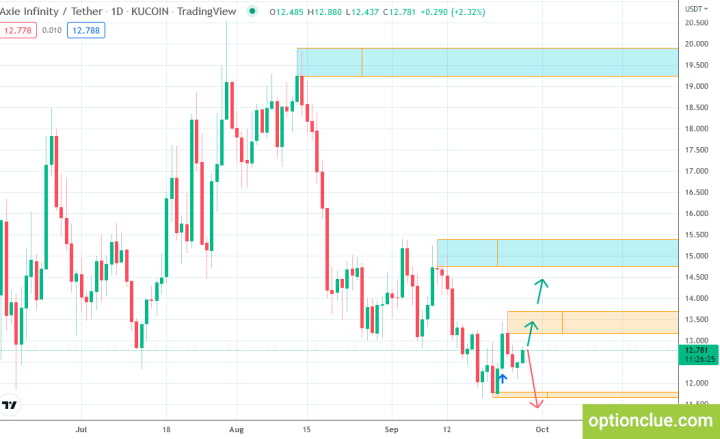
Axie Infinity / U.S. Dollar. Daily price chart. Technical analysis.
Binance Coin (BNB/USDT)
The market is in the uptrend on the Daily timeframe. The correction came to an end on September 26 and the pullback buying opportunity was formed.
The first target in the bullish movement is the resistance level formed on September 9 – 12 with the borders of $296.5 – $298.5.
If the market is closed above this resistance successfully, the price is likely to move forward to the target #2 – it is the resistance level with the borders of $336 – $328.5 formed on August 10 – 14.
Long positions will remain relevant until the market is above the nearest support level on the Daily timeframe. The borders of this support are $269.5 – $273.5.
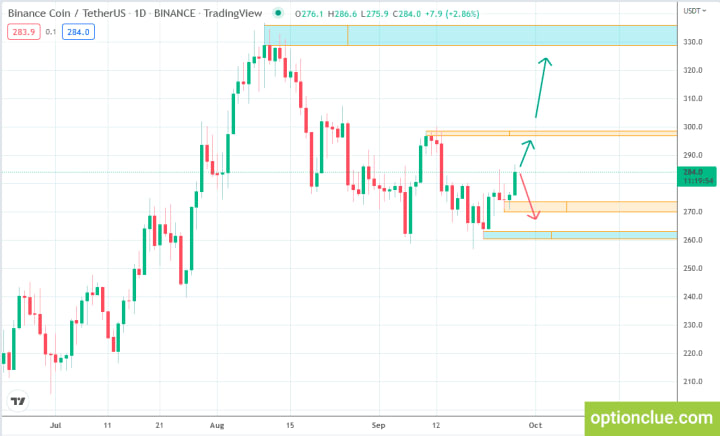
BNB / U.S. Dollar. Daily price chart. Technical analysis.
SAND (SAND/USDT)
The resistance level was broken on the Daily timeframe on September 23, the trend is bullish. The correction may come to an end today and the pullback buying opportunity can be formed.
The first target in the upward movement is the resistance level formed on September 23 – 25 with the borders of $0.919 – $0.94.
In case of successful development of the trend, a more distant target will be on the highs of September 9 – 12, where the next resistance is located with the borders of $0.9875 – $1.0250.
When breaking through the support, the trend will reverse and we should look for selling opportunities. The borders of this level are $0.8015 – $0.8150.
Longs will remain relevant until the market is above the nearest support level on the Daily chart, the lows of September 20 – 22.

SAND / U.S. Dollar. Daily price chart. Technical analysis.
Uniswap (UNI/USDT)
The market is currently breaking through the resistance level with the borders of $6.05 – $5.92. If today’s candle closes above this level, we will see the start of a bullish trend.
The price has already reached the next resistance level formed on September 9 – 13. The correction wave is likely to begin around this level.
A pullback buying opportunity will appear after the correction formation on the Daily timeframe.
The first targets in the upward movement are highs formed on August 20 – 26. It is the resistance level with the borders of $7.21 – $7.36.
Long positions will remain relevant until the market is above the nearest support level on the Daily chart, the lows of September 20 – 22.

UNI / U.S. Dollar. Daily price chart. Technical analysis.
Bottom Line
In terms of medium-term trading, tokens with the correction close to completion on the Daily timeframe and with potentially the most promising risk-reward ratio are Bitcoin and Axie Infinity.
In the near future, many tokens, for example Binance Coin, will provide excellent opportunities to enter the market with a huge reward / risk ratio.
We used support and resistance levels for the analysis in this market overview.
FYI. We are building an indicator that will automatically plot key levels on all timeframes on all popular tokens.
About the Creator
Keep reading
More stories from Anna Miroshnichenko and writers in Trader and other communities.
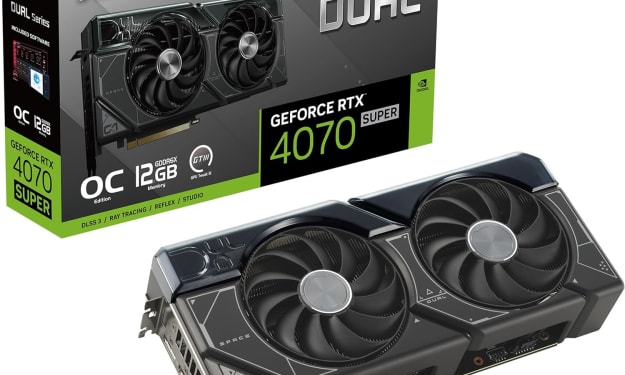
THE GRAPHICS CARD WILL MEET ALL YOUR DEMANDS ON YOUR PC
In the dynamic realm of computing, few components command as much attention and admiration as the graphics card. These technological powerhouses, often referred to simply as GPUs (Graphics Processing Units), serve as the beating heart of visual processing in modern computers, enabling everything from immersive gaming experiences to complex visual simulations and professional content creation. Among the latest contenders in this arena stands the ASUS Dual GeForce RTX 4070 Super OC Edition Graphics Card, a formidable specimen boasting cutting-edge features and unrivaled performance.
By Kim Long Nguyệt Ngữabout 14 hours ago in Trader
Was I a Model in Japan?
During my time in Nagoya I worked and lived at the strangely famous hostel and café Nagonoya. With its chequered floors and florescent lighting it felt quite dated, but I think that was supposed to be part of the charm. The dorms were always fully booked on weekends with domestic tourists and there was always a buzz in the downstairs café. Camera crews were constantly in and out of the place interviewing the Japanese staff members who worked the café. I think it had something to do with the egg sandwiches. At least that was what was on most of the merchandise, except for that one dishcloth with the owner’s face on it. Was I being employed by a local celebrity?
By Susanna Kiernan6 days ago in Wander


Comments
There are no comments for this story
Be the first to respond and start the conversation.