
Canada’s Economy Is Hooked on Mortgage Renewals, Not Resources
Why the Bank of Canada’s rate decisions hit household budgets faster than in the U.S., and what the next renewal window means for growth
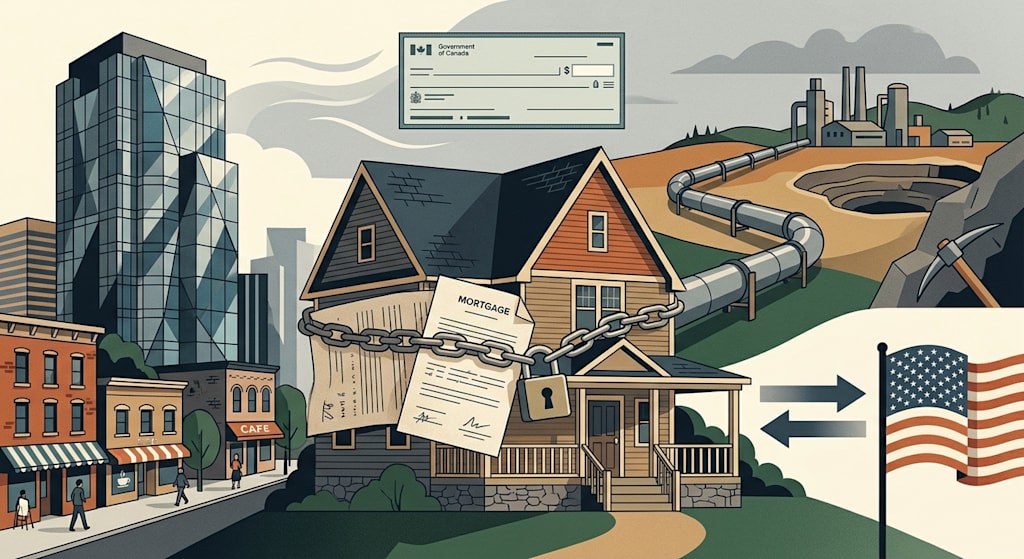
Canada’s economic model is often described with a short list: consumers spend, government cushions, resources export, banks and real estate dominate, and small firms fill the middle. That list is broadly right, but it becomes useful only when the connections between its parts are spelled out. The central connection runs through household balance sheets. Canada’s GDP is led by household consumption, but that consumption rests on some of the highest household debt in the G7 and on mortgages that reprice every few years. The result is an economy in which interest-rate changes reach household cash flow faster and more directly than in the United States. Resources provide a cyclical buffer. Trade with the United States provides the external circulation. Finance, real estate, and small and medium-sized enterprises provide employment and output in the middle. Government transfers protect incomes when demand falls, but they do not remove the debt stock that makes demand fragile in the first place.
First, the GDP arithmetic needs two corrections
In the expenditure measure of GDP, household final consumption is the largest component, at roughly 54–57 percent. Government final consumption is around 21 percent, and gross fixed capital formation is around 23 percent. Net exports are usually small, close to balance. Exports and imports each run at about one-third of GDP, so their gross sum is roughly two-thirds of GDP. That gross flow matters: a large share of Canadian production and income passes through cross-border transactions. But the net export line is small, which means trade’s marginal contribution to GDP growth is usually less visible than the contribution from consumption and investment. Canada depends on large trade flows, not on a large trade surplus.
The second correction concerns “government transfers.” Transfer payments, including pensions, employment insurance, and child benefits, move income between households. They raise disposable income, but they are not a separate expenditure component of GDP. The government component in expenditure GDP is government final consumption plus government fixed capital formation. This distinction matters for the argument. Government transfers can keep household spending from collapsing during a downturn, but they do not by themselves create a GDP expenditure category. They stabilize the income side of the household account. They do not erase the liability side.
Consumption is the largest engine, and the mortgage contract explains why
Household consumption is the largest single source of demand in Canada. The question is why it stays at that level and why it reacts to interest rates so quickly. The answer sits in the household balance sheet. Canada’s household debt-to-disposable-income ratio has long been among the highest in the G7. On an OECD basis, net household debt has run around 185 percent of net disposable income, compared with a G7 average near 120 percent and about 89 percent in Germany. Mortgage debt is the largest single liability. Canadian mortgages typically reprice every one to five years, with most borrowers on five-year fixed terms. A policy-rate change does not stay locked away for thirty years as it might in the U.S. housing finance system. It reaches monthly payments through renewal.
The transmission chain is concrete: policy rate changes, mortgage renewals reset monthly payments, the share of disposable income committed to housing changes, consumption changes, GDP changes. Mortgages issued in 2020–2021 at rates around 1.89–2.5 percent moved into renewal windows in 2024–2026 facing rates around 4–5 percent. For some borrowers, monthly payments rose by 15–20 percent. In 2024–2025, about 2.2 million mortgages, covering roughly C$675 billion, faced a rate shock, about 45 percent of the outstanding mortgage stock. This is why Canadian consumption can contract more directly than U.S. consumption when the Bank of Canada tightens. The sensitivity comes from the mortgage contract, not from a cultural preference for spending.
Government intervention in Canada works mainly through transfer payments that buffer household cash flow and through public-sector employment and services that provide a relatively stable block of demand, rather than through large fiscal stimulus that replaces private consumption. Transfers keep deleveraging from turning into a demand collapse. They do not reduce the stock of debt. That limit matters because the renewal window keeps rolling.
Resources are a buffer, not the daily engine
Canada’s resource sector is often reduced to the phrase “natural resources” without specifying what those resources are or what they do for the economy. The sector includes oil sands, natural gas, hydroelectricity, potash, uranium, gold, copper, aluminum, nickel, cobalt, lithium, graphite, and forestry products. In 2024, the natural-resource sector accounted for about 16.0 percent of nominal GDP when direct and indirect effects are included, roughly C$459 billion. Resource exports made up 53 percent of Canada’s merchandise exports. The sector employed about 1.8 million people directly and indirectly. Oil and gas extraction alone is about 5 percent of GDP directly, which is substantial but not overwhelming. Governments received an average of about C$33.7 billion a year from the resource sector between 2019 and 2023.
The strategic role of resources is to provide foreign-exchange earnings and a fiscal base that few other sectors can replace, not to dominate GDP. When energy and commodity prices rise, the Canadian dollar, federal and provincial finances, and resource-region employment all benefit. When prices fall, adjustment falls on resource regions and linked industries. The resource sector does not set the day-to-day pace of Canadian GDP. It sets the thickness of the cushion when the consumption-and-housing chain is under stress. That cushion has a condition attached: it depends on global prices that Canada does not set.
Finance, real estate, and small firms form the middle layer
The corporate picture is more fragmented than the headline presence of large banks and resource companies suggests. Real estate and rental activity alone is about 13 percent of GDP. Finance and insurance is about 7 percent. Manufacturing is about 10.4 percent overall; automobile and parts manufacturing contributed about 0.7 percent of GDP in 2024, roughly C$16.8 billion. Manufacturing exists, but it is not the spine of the economy. It is a regional supply chain deeply integrated with the United States, with Ontario vehicle assembly and Quebec aerospace as important nodes. Its size is not enough to set the national economic direction.
Small and medium-sized enterprises carry the middle. About 98 percent of Canadian businesses are SMEs. They employ about 64 percent of Canadian workers and contribute around 48.2 percent of GDP, with recent averages near 50 percent. This structure makes the economy sensitive to credit conditions. SMEs do not issue bonds the way large firms do. Their expansion and survival depend on bank credit and internal cash flow. When rates rise and credit tightens, the first firms to cut investment and hiring are usually the SME block, not resource majors. Business insolvency applications rose 41 percent in 2023 from 2022 and another 187 percent year over year in the first quarter of 2024. Most of those filings were SMEs. That is a main channel through which interest rates reach output and employment.
The external side runs through the United States
In 2024, Canada sent 75.9 percent of its exports to the United States and bought 62.2 percent of its imports from the United States. Exports to the U.S. are roughly a quarter of Canadian GDP. A large part of Canada–U.S. trade is intra-firm and intra-industry: auto parts and vehicles cross the border multiple times, pipelines and electricity grids connect directly. This integration is an efficiency source in normal years and a transmission amplifier in years of trade friction or demand shocks. A U.S. demand contraction reaches Canadian exports, employment, and investment faster than it reaches most other economies.
The external account also explains why the resource cushion matters. Resource exports support the current account and the Canadian dollar when the consumption-and-housing chain weakens. They do not replace structural growth in productivity or business investment. They buy time. They do not change the household debt stock or the renewal calendar.
The policy problem is asymmetric
Canadian macroeconomic management faces an asymmetric problem. Lower rates relieve renewal pressure and support consumption, but they can also restart debt growth in housing. Higher rates suppress inflation and excessive borrowing, but they squeeze consumption through monthly payments, and consumption is the largest GDP component. Government transfers and public spending can absorb part of the downside, but they work on income volatility, not on debt stock. The difficulty is timing and force, not whether to cushion, in an economy where consumption and debt are linked through the mortgage contract.
The next renewal window will do more to set the pace of Canadian demand than any slogan about resources or innovation. The balance sheet, not the brochure, sets the timetable.
About the Creator
Jin
Writer of reamstories
https://reamstories.com/jin
Enjoyed the story? Support the Creator.
Subscribe for free to receive all their stories in your feed. You could also become a paid subscriber, letting them know you appreciate their work.
Comments
There are no comments for this story
Be the first to respond and start the conversation.