
Applying the Darvas Method
Can Nicolas Darvas's investing strategy be duplicated?

Recently I reviewed Nicolas Darvas amazing little book, How I Made $2,000,000 in the Stock Market. Now I'll look at his methodology in more detail with an eye to seeing if his feat can be easily replicated. The short answer is no. If it could, there would now be thousands of millionaires who made their money using the Darvas method. Many people have studied his methods. Many have achieved some success in the stock market. But few if any managed to turn $25,000 into $2,000,000 in the short eighteen months Darvas did it in. We’ll get into the reasons for this later.
But the Darvas method contains some valuable truths that can be applied to improve our own stock market performance. The most important of these is the concept of the Darvas box.
The Darvas Box
What is a Darvas box? In his investigations of stock price movements, Darvas discovered that stocks don’t move in a straight line. They fluctuate up and down. But a stock in an up trend has a peculiar pattern, a rhythm that can be observed and used to time one’s stock purchases and place one’s stop loss orders.
What Darvas observed was that up trending stocks typically advance for a while, then stall and consolidate, then advance again. This stalling and consolidation process he called forming a box. For example, a stock might have the following price pattern 22, 25, 24, 26, 27, 30, 29, 29, 27, 28, 29, 29, 30, 28, 29. The stock advanced from 22 to 30 and then started stalling and consolidating, falling back to 27. The pattern above would, in Darvas view, have formed a box or frame with a high of 30 and a low of 27. The stock oscillates between those figures.
The upper edge of the box is formed when the stock retreats from its high and stays below it for three consecutive days. So the move from 25 to 24 did not signal the top of a box as the stock moved up again after that. But when it hit 30, it stayed below that level. After the top of a box is formed, the bottom is formed when the stock advances from a low for three consecutive days without breaking out of the box to the upside. In our example, it is 27. This Darvas would call a 27/30 box which is a pretty tight frame. The depth of the box may vary each time one is formed.
Once a box is firmly established, Darvas says a break out above the upper line of the box is a buy signal. A drop below the bottom of the box is a sign that the stock’s trend has changed and a sell signal.
Darvas was also very keen on volume. Increasing volume on a rising stock indicated buyer interest. Once he discovered a stock that was rising with increasing volume, he would wait for a box to develop. Then he would issue an on stop buy order to buy the stock when it broke out of the box.
An on stop buy order is the opposite of a stop loss order. It is an instruction to your broker to buy the stock only after it has climbed to a certain level. It seems almost counter-intuitive to the way most investors think. Many, if not most, would think “buy low” and tell their brokers, when the stock drops to this level, buy me some. The on stop buy order says I’m not interested until the stock has proven itself by climbing to a certain level. It is the tool in trade of the contrarian investor who, instead of following the rule of buy low, sell high, follows the rule of buy high, sell higher. I used to think this was a crazy idea until I read William O’Neil’s How to Make Money in Stocks. In fact, there are many similarities between O’Neil’s CANSLIM method and Darvas’s approach.
In our example, Darvas would issue a buy order at 31. Immediately he would also issue a stop loss order at the top of the box or 30 in our example. He reasoned that if the stock was behaving correctly, it should advance once it broke out of the box. If it retreated, he had made a mistake and wanted to be out of the stock quickly with a minimal loss. He recognized that this might result in being stopped out quite a few times, but the advances would take care of that.
It was the famous financier and advisor to presidents, Bernard Baruch, who once said “Even being right 3 or 4 times out of 10 should yield a person a fortune if he has the sense to cut his losses quickly on the ventures where he has been wrong.” A point reiterated by Darvas.
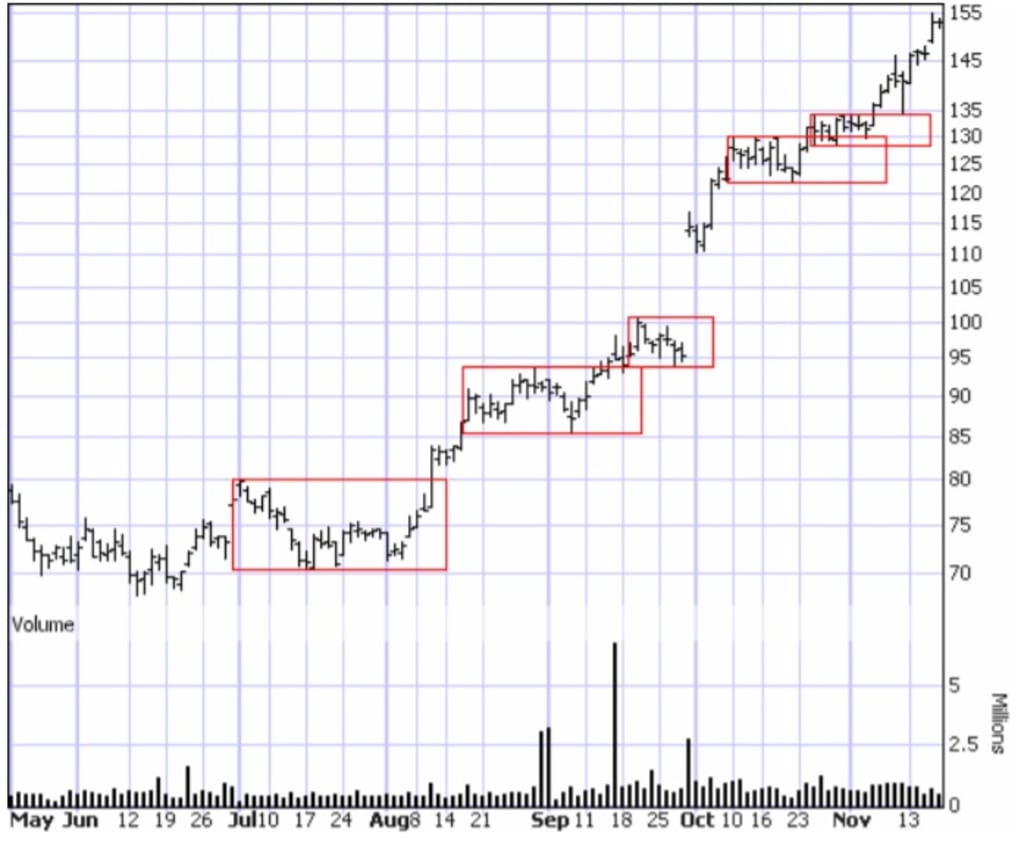
The best way to see the Darvas box method is graphically. Consider Research in Motion. (This article was written in 2006.) This stock had been on a solid up trend from early 2003 through the end of 2004, rising from $8.50 to $110. The stock then drifted in a wide sideways pattern to mid-2006, fluctuating between $70 and $105. Now Darvas only bought stocks that were hitting all time highs. Research in Motion hit an all time high of $130 (split adjusted) on February 28, 2000, so Darvas may not have been interested in RIM until it broke through that high. But for the sake of our example, we’ll look at the boxes since June 2006. We rated Research in Motion a buy again on July 10th using our method of a bounce off the 30 day moving average after a change in direction of the moving average to the upside. (I published a financial newsletter from 2003-2008.) So we’ll look at the boxes since then.

As you can see, there have been five Darvas boxes formed since we issued our buy rating on July 10th. Darvas probed his stocks by buying in increments. If he had bought when we rated Research in Motion a buy, he likely would have sold when it hit 75, bought back in when it broke above 80, bought some more when it broke above 94 and bought a lot more when it spiked up on Sept. 29th. And if he was not yet fully invested at the time, he would have bought more when the stock broke above 130 and even more above 134. Each break out from a box to the upside is a buy signal.
The chart above graphically shows how boxes pyramid upwards in an up trending stock. Sometimes, as in the last two boxes, they overlap.
Darvas used stop losses, the initial one very tight but subsequent ones a bit looser. When a new box formed, Darvas would raise the stop to the bottom of the new box. In the case of Research in Motion, he would have raised the stops progressively to 86, 94, 122 and 128. which would be the current stop.
As I noted at the beginning of this article, Darvas’s results cannot be easily duplicated. The reason is because of a Darvas idiosyncrasy he shared with Jesse Livermore. He was a plunger. He followed very few stocks and invested in even fewer. And when he did, he went whole hog and used margin, a dangerous prescription.
For example, after some initial successes had built up his capital position, he bought 500 shares of E.L. Bruce (makers of Bruce Hardwood Flooring which is still around today) at 50 ¾ . He bought another 500 shares at 51 1/8, another 500 at 51 ¾ another 500 at 52 ¾ and a final 500 shares at 53 5/8. He bought $130,687.55 worth of this one stock. It was his only holding and 50% of that was on margin. Plunger indeed!
Then Darvas got very lucky indeed. Unknown to the general public, Bruce was the subject of takeover negotiations. Short sellers, not knowing this, pooh-poohed the rise in price and start selling short. As the price continued to rise, the shorts were in a frenzy trying to sell and close their positions. Things got so crazy that trading in the stock was halted. The shorts scrambled to buy the stock over-the-counter privately. Darvas broker told him he could sell out for $100 a share. Then he did something most people would probably not have the guts to do. He told his broker no and hung on. The offers went up and eventually Darvas sold out all his Bruce at an average price of $171. He made a profit of $295,305.45.
Now that is a combination of skillful stock picking, high risk (by ignoring the usual advice of diversifying), guts and just plain good luck. So replicating Darvas would take a combination of guts and foolishness most people just do not have.
That said, his box method is intriguing and fairly easy to follow.
Here is the progression of Darvas’s trades to $2 million. Remember, he used margin and so invested more than he actually had in cash. First trade noted below was in November 1957.
- bought 200 Lorillard at 28 ¾, 200 at 35, 200 at 36 ½ and 400 at 38 5/8. Invested $35,827.50
- bought 500 Diner’s Club at 24 ½ , 500 at 26 1/8. Invested $25,520.80
- sold Diner’s Club for $35,848.85
- sold Lorillard for $56,880.45
- bought E.L. Bruce in 5 increments between 50 ¾ and 53 5/8 for $130,687.55
- sold E.L. Bruce for $425,993
- lost small amounts on Molybdenum and Haveg Industries. Lost about $6500 trying Lorillard again after which he had a total profit of $318,686.45
- bought 300 Universal Controls at 35 ¼ , 1200 at 36 ½ , 1500 at 40. Total $115,313.49
- bought 200 Thiokol at 47 ¼ , 1300 at 49 ½. Total invested: $74,943.98
- a rights offer came from Thiokol which enabled him to convert to a highly leveraged position of 6000 shares for a cost of $350,820
- combined holdings of Thiokol and Universal Controls climbs to over half million
- got over-confident, ignored his rules and lost $96,588.66 trading 14 different stocks (he calls it his mad period). Still held Thiokol and Universal Controls through this period.
- traded a variety of stocks for a profit of $25,000 (he lists 11 stocks)
- sold Universal Controls for $524,669.97
- bought 2000 Texas Instruments at 94 3/8, 1500 at 97 7/8, 200 at 101 7/8. Total $541,996.95
- sold Thiokol for $1,212,851.52
- after probing four stocks, bought $574,842.25 of Zenith, $567,820.60 of Fairchild Camera
- 3 positions - Zenith, Fairchild and Texas Instruments – valued over $2,250,000 in July 1959
Now while it is difficult to emulate Darvas because of his practice of leveraging his positions and plunging rather than diversifying, his methods can still be useful in deciding when to buy and for placing stop losses. His is a fascinating study in stock trading.
Postcript: If you missed my original review of Darvas's book, you'll find it linked at the top and below.
If you like this article, why not heart it. Vocal pays me six tenths of a cent on each page view. If you'd like to tip me a bit more, that would be much appreciated. Below is a link to my previous review of Daras's book and to a biography of Jesse Livermore whose trading style was similar to Darvas's.
- How I Made $2,000,000 in the Stock Market
- Jesse Livermore: World's Greatest Stock Trader
- Index of My Writing – an index of all my scribblings on Vocal including essays on politics, philosophy, music, travel, personal experiences and even some short stories and poetry.
About the Creator
Marco den Ouden
Marco is the published author of two books on investing in the stock market. Since retiring in 2014 after forty years in broadcast journalism, Marco has become an avid blogger on philosophy, travel, and music He also writes short stories.
Keep reading
More stories from Marco den Ouden and writers in Trader and other communities.
How I Made $2,000,000 in the Stock Market
I’d wanted to read this stock market classic for a long time but it is notoriously hard to find. Finally I bought it through a reseller on Amazon.com. The seller was in England and the book arrived in my mailbox a couple of weeks later. It was worth the wait!
By Marco den Ouden2 years ago in Trader
How to become an Amazon Merch seller!!
In today's digital age, opportunities for creative entrepreneurs to showcase their talents and earn a living abound. One such platform that has gained significant popularity is Amazon Merch, an innovative program that allows individuals to design and sell their own merchandise directly on Amazon. From T-shirts and hoodies to pop sockets and mugs, Amazon Merch offers a wide range of products for creators to showcase their unique designs and reach a global audience.
By Willow Peddy3 days ago in Trader


Comments
There are no comments for this story
Be the first to respond and start the conversation.