
OKX and Hyperliquid Stock Perpetuals — “Same Volume, Different Quality”: A 13x Gap in Trading Costs
Why similar trading volumes can hide major differences in liquidity, slippage, and real execution costs

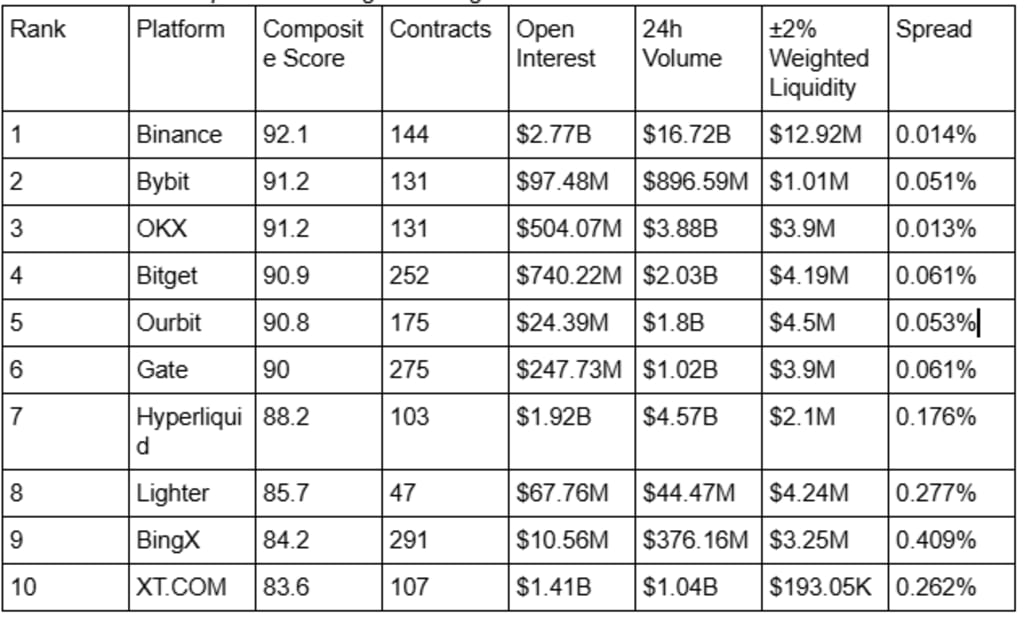
When analyzing the strength of stock perpetual contracts across major trading platforms, why should we abandon “volume-only thinking”? According to RootData’s snapshot at 17:30 on July 23, 2026, viewed through a stock-derivatives spread-analysis framework, Hyperliquid ranks second with $4.57 billion in 24-hour volume, closely trailing OKX’s $3.88 billion. But RootData’s data from the same period shows a significant difference in the two platforms’ actual execution experience. Combined with the tokenized-stock rankings, Hyperliquid’s ±2% weighted liquidity is $2.1 million with a bid-ask spread as high as 0.176% — 13.5 times that of OKX (0.013%).In this snapshot, Hyperliquid’s quoted spread was 13.5 times wider than OKX’s. However, the realized cost of a trade would also depend on order size, available depth, fees, slippage, and funding rates.
The spread chasm behind similar volumes
The gap is even clearer in composite scores. In RootData’s ranking system, OKX ranks third with 91.2 points, while Hyperliquid comes seventh with 88.2. The core difference lies in execution quality: OKX’s ±2% weighted liquidity is $3.9 million with a spread of just 0.013%, among the lowest of all 29 platforms; by contrast, Hyperliquid’s liquidity is $2.1 million with a spread as high as 0.176%. For users who trade frequently or place large orders, this cost difference directly erodes returns.
In terms of contract coverage, OKX offers 131 contracts and Hyperliquid 103 — not far apart — but in execution economics they are no longer in the same tier. This “same volume, different quality” phenomenon shows that platforms with similar volumes can differ enormously in execution experience; investors cannot make a choice based on volume ranking alone.
Why the cost gap grows with order size
The practical impact of a spread becomes more visible as trade size increases. A tight quoted spread generally allows traders to enter and exit closer to the displayed market price, while a wider spread creates an immediate cost before fees, funding rates, or market movement are considered. Order-book depth adds another layer to this calculation. Even when two platforms report similar daily volume, the exchange with more liquidity near the current price may absorb larger orders with less slippage. In this comparison, OKX combines $3.9 million in ±2% weighted liquidity with a 0.013% spread, while Hyperliquid shows $2.1 million in weighted liquidity and a 0.176% spread. The difference may appear small when expressed as percentages, but it becomes more meaningful across repeated trades or larger positions. A trader who opens and closes positions frequently can pay the spread multiple times, turning a modest-looking execution disadvantage into a material drag on performance. This is why headline volume should be treated as an activity indicator rather than a complete measure of market quality. A more useful comparison also considers spread stability, available depth, expected slippage, trading fees, and funding costs under the trader’s actual order size and strategy.
User behavior reflected in position structure
On open interest (OI), Hyperliquid’s $1.92 billion far exceeds OKX’s $504.07 million, indicating more active market participation on the position dimension. This combination of “high volume + high open interest + high spread” suggests Hyperliquid’s user base may lean more toward short-term speculation or high-leverage trading, whereas OKX has done more to optimize order-book depth and quote tightness.
For institutional investors or large traders who prioritize execution quality, spreads and liquidity may carry more reference value than volume itself. Competition in the tokenized-stock arena is shifting from “who has the largest volume” to “who has the lowest trading cost.” When choosing a platform, investors should write out their own order size, acceptable slippage, and holding period as explicit criteria, then check them one by one against the order book and fee structure — rather than simply following volume rankings.
The comparison does not establish that one platform is universally better than the other. It shows why volume should be read alongside quoted spreads, available liquidity, open interest, fees, funding rates, and the size of the intended order. Because these figures represent a single market snapshot, traders should review current order-book conditions before drawing conclusions about execution quality.
About the Creator
Enjoyed the story? Support the Creator.
Subscribe for free to receive all their stories in your feed.
Comments
There are no comments for this story
Be the first to respond and start the conversation.