
The End of Dashboards and Design Systems
Design is becoming quietly human again.

In the year 2035, the world no longer looked at data the way it used to. Screens still existed, yes—but dashboards, as people once knew them, had quietly begun to disappear. It didn’t happen overnight. It was a slow fading, like old paint peeling off a wall that nobody bothered to repaint.
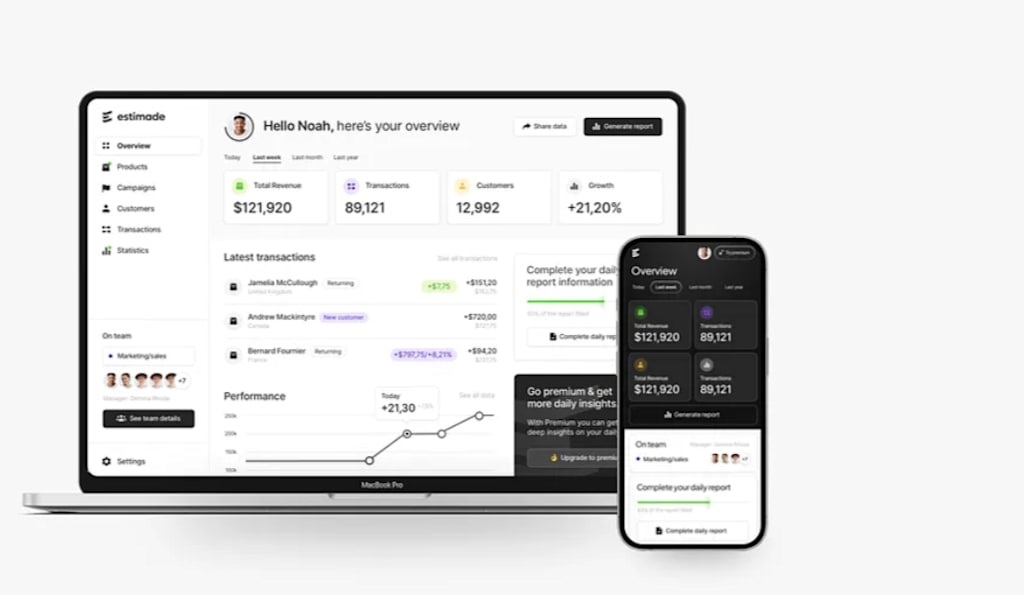
The image on the old laptop in the museum was one of the last surviving examples: a clean, modern analytics dashboard showing revenue, transactions, customers, and growth percentages. Next to it stood a phone with a compact version of the same system. Visitors often stared at it with curiosity, wondering why something so “organized” had ever been replaced.
But the truth was simple: it had become too rigid for a world that no longer wanted structure in boxes.
Back when companies relied on dashboards, everything had to be neatly arranged—charts in one section, numbers in another, filters on the side. Designers spent years building “design systems” to make sure every button, every font, every color followed strict rules. It made sense at the time. Businesses needed consistency. Developers needed structure. Users needed clarity.
Yet something was always missing: understanding.
People didn’t want to interpret dashboards anymore. They wanted answers.
That shift began quietly inside a small startup called Estimade, the same name faintly visible on the old interface in the museum. At first, it was just another analytics tool. It showed revenue, transactions, and customer growth in neat cards. Managers loved it because it looked professional. Teams trusted it because it was accurate.
But one day, an engineer asked a simple question:
“What if the dashboard just told you what to do?”
At first, the idea sounded ridiculous. Dashboards were not supposed to “think.” They were supposed to display. But curiosity is dangerous in technology. It spreads quickly.
Within months, the system evolved. Instead of showing “$121,920 revenue,” it began saying:
“Revenue increased because returning customers grew by 12%. Focus on retention campaigns.”
Instead of “89,121 transactions,” it said:
“Transaction volume is stable, but high-value purchases are declining.”
And instead of charts filled with lines and dots, it started speaking in patterns, predictions, and suggestions.
People were confused at first. Managers missed their charts. Analysts missed their spreadsheets. Designers missed the control of placing every element perfectly on a grid.
But something unexpected happened: work got easier.
Teams stopped analyzing dashboards and started acting on insights. Meetings became shorter. Decisions became faster. The “overview screen” no longer needed to be opened and studied—it simply notified users of what mattered.
As AI systems grew more advanced, they began removing even more structure. The concept of a “design system” started to break apart. Why should a button always look the same if its purpose changed depending on context? Why should a dashboard always be a dashboard if it could become a conversation?
Interfaces became fluid. Sometimes data appeared as voice. Sometimes as motion. Sometimes it didn’t appear at all—it simply triggered an action in the background.
A marketing manager once described it like this:
“It feels like the system is thinking with me instead of asking me to read it.”
Not everyone was comfortable with this shift. Traditional designers argued that removing structure meant losing control. Developers worried that without design systems, chaos would return. But the new generation saw it differently.
They saw freedom.
In schools, students no longer learned how to build dashboards. They learned how to design intent—how to express what a system should mean, not just how it should look. Interfaces were no longer constructed like buildings; they grew like living organisms, adapting to each user.
The laptop and phone in the museum were labeled as “Phase 2 Interfaces.” Visitors were told that these were the final generation of traditional dashboards before adaptive systems replaced them entirely.
One child once asked the guide, “So where did all the charts go?”
The guide smiled and replied, “They didn’t disappear. They just stopped needing to be seen.”
By the time 2035 fully arrived, most companies no longer had dashboards at all. Instead, they had “decision layers”—invisible systems that observed, predicted, and acted. Design systems still existed in history books, remembered as the foundation that once made digital products consistent. But consistency was no longer the goal.
Understanding was.
And somewhere deep inside those invisible systems, the old dashboard still existed—not as a screen, but as memory. A memory of a time when humans needed to look at numbers to understand their world, before the world learned to explain itself.
About the Creator
Niaz muhammad MUHAMMAD
I share my story of starting from zero learning freelancing and digital skills step by step. Here you’ll find online earning tips, real experiences, motivation, and simple guides to help beginners grow and succeed online.thanks read my list
Enjoyed the story? Support the Creator.
Subscribe for free to receive all their stories in your feed.
Comments
There are no comments for this story
Be the first to respond and start the conversation.