
Introduction to Candlestick Patterns: A Comprehensive Guide
Here in this article, We will delve into the fundamentals of candlestick patterns, examining their significance in trading as well as their history and constituent parts.

Originating in Japan, candlestick patterns have been a well-liked technique in technical analysis for generations. Candlestick patterns are useful tools that give traders insightful information about market trends and can help in decision-making. Understanding candlestick patterns is crucial for seeing probable trend reversals, validating market trends, and properly timing your trades whether you are a novice or seasoned trader.
Here in this article, We will delve into the fundamentals of candlestick patterns, examining their significance in trading as well as its history and constituent parts.
History of Candlestick Patterns
The origin of candlestick patterns dates back to 17th century Japan. These patterns were originally used for the analysis of the rice market in Japan.
It was first developed by a Japanese rice trader named Munehisa Homma. Homma recognized the significance of tracking price movements and market psychology in predicting future price trends.
Homma created a technique that required keeping track of the open, closing, high, and low prices of each trading session as a result of his observations and research of the rice market. He used what are now referred to as candlestick charts to visualize this data. Homma represented price changes on his charts with slender wooden pieces that resembled candlesticks.
Homma found that by examining the relationship between the highs and lows as well as the opening and closing prices, he could get insightful knowledge into the mood of the market and forecast future price changes. This discovery served as the cornerstone for the development of candlestick patterns.
Candlestick charts and patterns gained popularity in Japan, primarily among rice traders, and were further developed and refined over time. However, it wasn't until the late 19th century that these techniques made their way to the Western world. In the 1980s, renowned author and technical analyst Steve Nison introduced candlestick charting to the Western financial markets with his book "Japanese Candlestick Charting Techniques."
Components of Candlestick Patterns
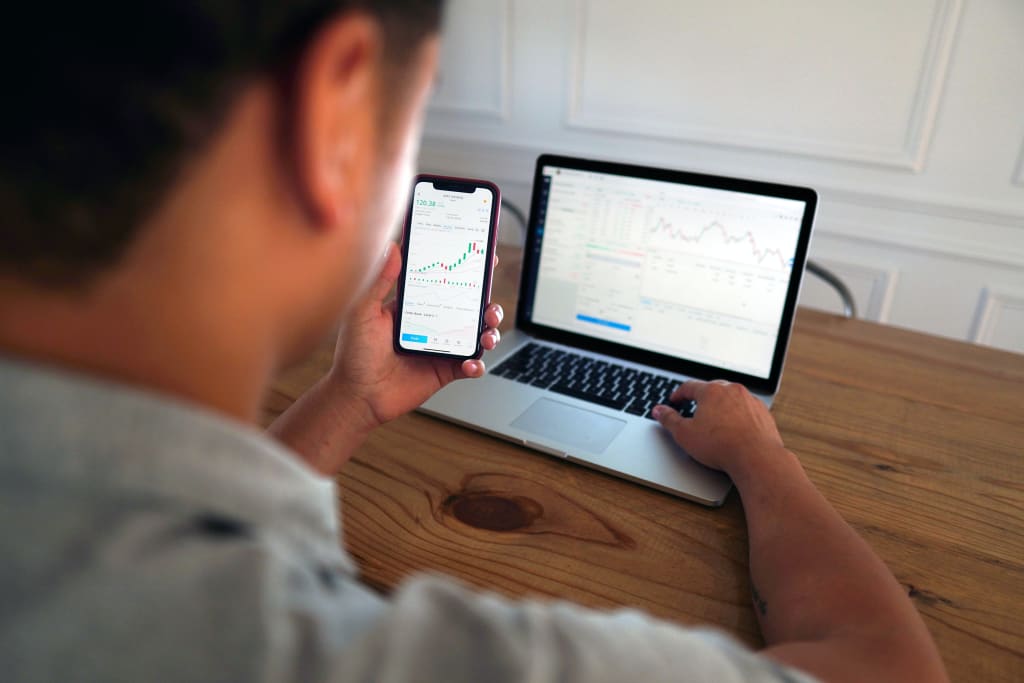
Candlestick patterns consist of four main components: The open, close, high, and low prices. Each candlestick represents a specific time period, such as a day or an hour. The body of the candlestick represents the price range between the open and close, while the wicks (also known as shadows) indicate the price range between the high and low. By analyzing the relationship between these components, traders can gain insights into market dynamics and potential price movements.
Bullish Candlestick Patterns
Bullish candlestick patterns are patterns on a chart that suggest potential price movement in the upward direction. These combinations of candlestick patterns give traders important information about buying pressure and potential trend reversals or continuations. Understanding bullish candlestick patterns can aid traders in locating advantageous entry points and utilizing risk management strategies.These patterns suggest that buyers have gained control and may lead to a reversal or continuation of an existing uptrend.
Example of commonly known Bullish Candlestick Patterns:
- Hammer
- Bullish Engulfing
- Morning Star
It's important to note that these patterns should be confirmed by other indicators or factors before making trading decisions. Additionally, it's essential to consider the overall market conditions and other relevant factors to increase the probability of successful trades.
Bearish Candlestick Patterns
Totally opposite of Bullish Candlestick Patterns , these patterns represent potential downward price movement and bearish sentiment in the market. These indicate that sellers are gaining control, signaling a potential reversal or continuation of a downtrend. Recognizing these patterns can help traders identify opportunities to sell or take short positions.
Example of commonly known Bearish Candlestick Patterns:
- Shooting Star
- Bearish Engulfing
- Evening Star
- Dark Cloud Cover
The art of deciphering bearish candlestick patterns requires a lot of practise, observation, and learning from real-world market situations. Traders can improve their capacity to spot probable price reversals, validate market trends, and make wise trading decisions by having a solid understanding of these patterns and their ramifications.
Conclusion
Candlestick patterns serve as a valuable tool in technical analysis, providing traders with visual representations of market sentiment and potential price movements. By understanding the history, components, and significance of these patterns, traders can enhance their ability to identify trends, predict reversals, and time their trades effectively.
About the Creator
Keep reading
More stories from Brandy Connolly and writers in Journal and other communities.
Tips and Tricks to Buy the Perfect Perfume for Women
Fragrances have always held a special place in our lives. The way we smell can have a significant impact on our overall impression and how others perceive us. For women, smelling good is not just about personal hygiene; it is a way to express their personality, boost confidence, and leave a lasting impression. The seductive and unforgettable fragrances can play a pivotal role in achieving this. In this blog post, we will explore why women need to always smell good and provide some valuable tips and tricks to help you buy the perfect branded perfume for women.
By Brandy Connolly11 months ago in Journal
Machine Learning Development: Empowering Innovation and Efficiency
Machine learning development has revolutionized the way businesses operate, enabling them to harness the power of data to drive innovation, enhance decision-making, and optimize processes. In today's digital age, machine learning has become a cornerstone of technological advancement, offering unprecedented opportunities for organizations to extract valuable insights from vast amounts of data. This article delves into the realm of machine learning development, exploring its significance, trends, and the role of machine learning as a service and machine learning developers in shaping the future of AI-driven solutions.
By Sphinx Shivraj5 days ago in Journal
Remembering the rink
If you were there, you’ll never forget it. For decades, Durham Ice Rink was at the heart of the city’s social life. From Friday night ice discos to crowds roaring on the Wasps every Sunday, not to mention a proud history of figure skating and speed skating, the riverside rink was the place to be.
By Andy Potts4 days ago in Art


Comments
There are no comments for this story
Be the first to respond and start the conversation.