
Halloween Costume & Candy Shopping Ads Insights
This Halloween season has certainly been different compared to previous years, amidst the COVID19 pandemic. In our most recent blog post, we analyzed retailers with the most aggressive pricing strategies for costumes and candies.

This Halloween season has certainly been different compared to previous years, amidst the COVID19 pandemic. In our most recent blog post, we analyzed retailers with the most aggressive pricing strategies for costumes and candies. For our next analysis, we’ve ranked the top ads for costumes and candies. Using GrowByData Ad Intelligence solution, we collected and analyzed the Halloween shopping ads data of 1,282 highly competitive broad-match type opportunity keywords for Halloween costumes and candies with a monthly search volume of up to 25 Million (per Google’s Keyword Planner). The product information and ad data were collected daily from October 6th to October 28th, from 4 states in the US – Virginia, Ohio, California, and Oregon.
•
o Number of keywords: 1,282 Monthly Search Volume: 25 Million
o Number of Ads: 530K Number of Unique Ads: 66K
o Number of Advertisers: 2K
The following are our insights from the ads market analysis of Halloween costumes and candies:
1. Most Popular Costumes and Candies Based on Ad Impressions
Costume:
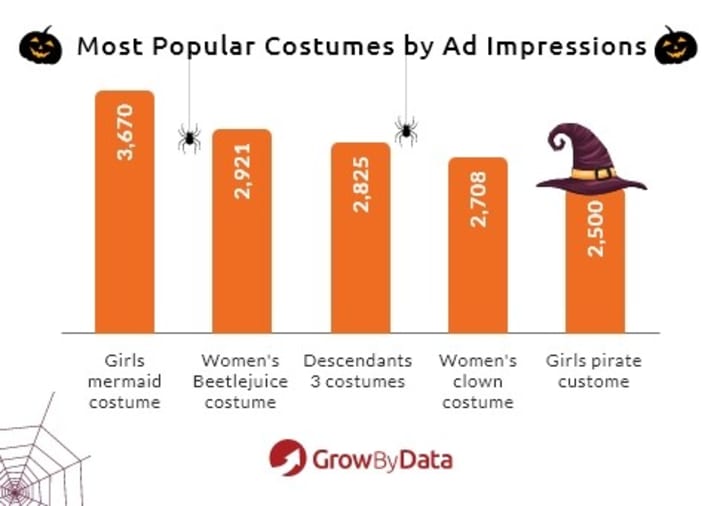
The most sought after costume this Halloween seems to be the mermaid, with 3,670 ad impressions, followed by the Beetlejuice costume with 2,921 ad impressions. 78% of the impressions came from mobile devices and only 22% from desktops.
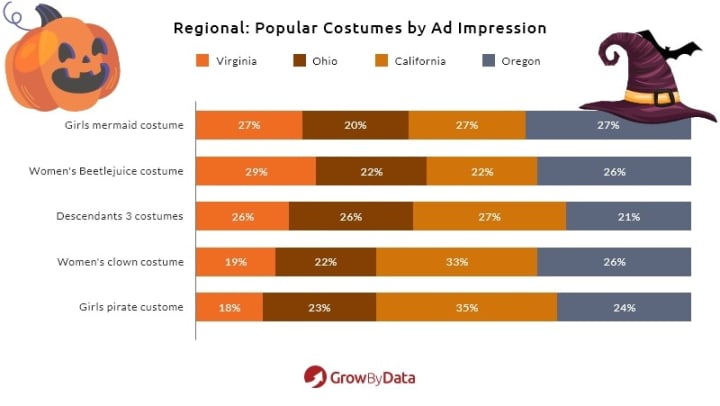
Looking into the most popular costumes in each of the 4 states, we found women’s clown costumes and girls pirate costumes to be popular choices in California. Women’s Beetlejuice costumes seem to be a popular choice in Virginia.
Candy:
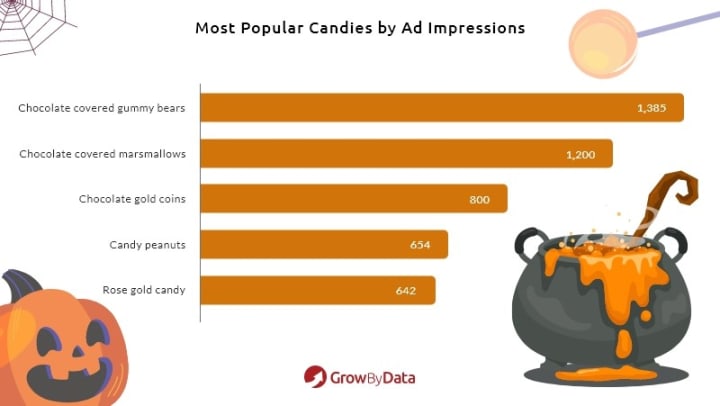
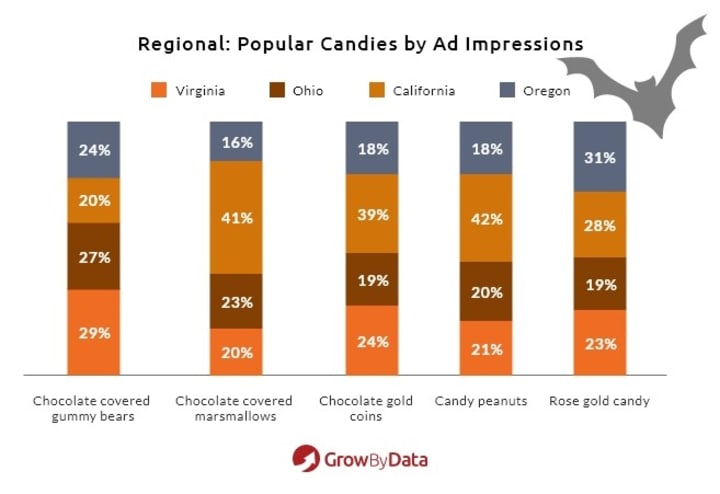
‘Chocolate covered gummy bears’ and ‘chocolate covered marshmallows’ were found to be the most popular choices of candy over the past 3 weeks, receiving 1,385 and 1,200 searches. Other popular choices were gold coins, candy peanuts, and rose gold candies.
Looking further into these 5 popular candies, we analyzed their popularity in each region as presented on the graph below. Chocolate covered marshmallows, chocolate gold coins, and candy peanuts are extremely popular in the California region but unpopular in the Oregon region. Rose gold candy looks to be the favorite in Oregon.
2. Top Advertisers based on Ad Impressions
Costume:
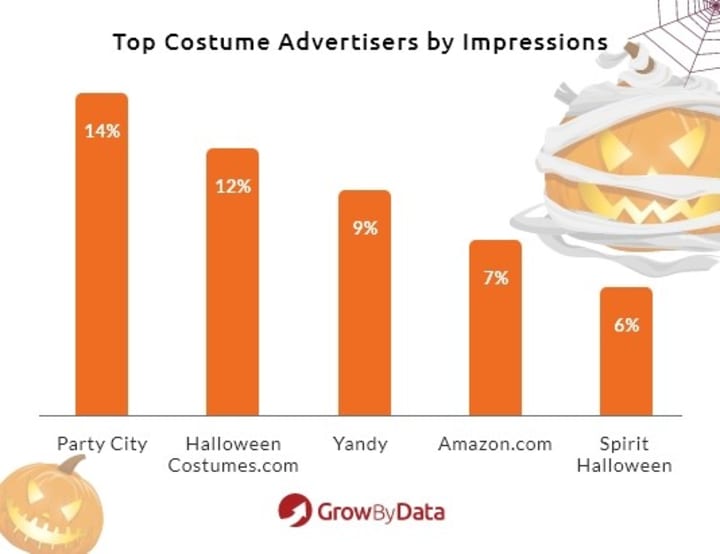
Our data shows specialty retailers who are very active during the Halloween season are the top advertisers for costumes. Specialty stores like Party City and HalloweeenCostumes.com seem the top advertisers. Party City tops the list, receiving almost 14% of all impressions on costume-related keywords, followed closely by HalloweenCostumes.com (12%). Amazon comes in 4th place, getting 7% of the ad impressions. Target (5.7%) and Walmart (3.2%) are in the 6th and 7th positions respectively.
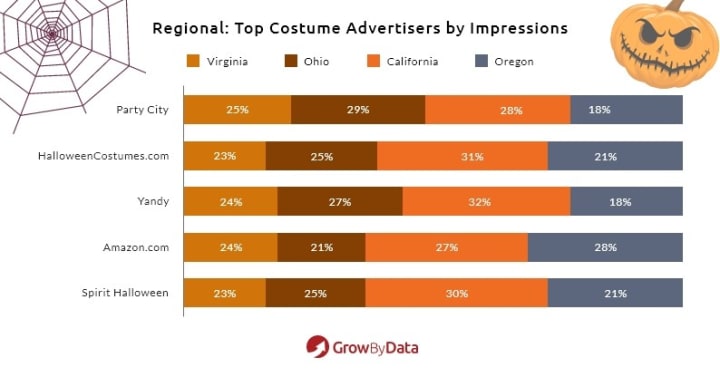
Below, looking at the regional impressions of the top 5 advertisers, Amazon.com has the highest impressions by far in Oregon, while others have targeted this state the least. Ad impressions on the top 5 advertisers are evenly distributed in the California and Virginia states.
Candy:
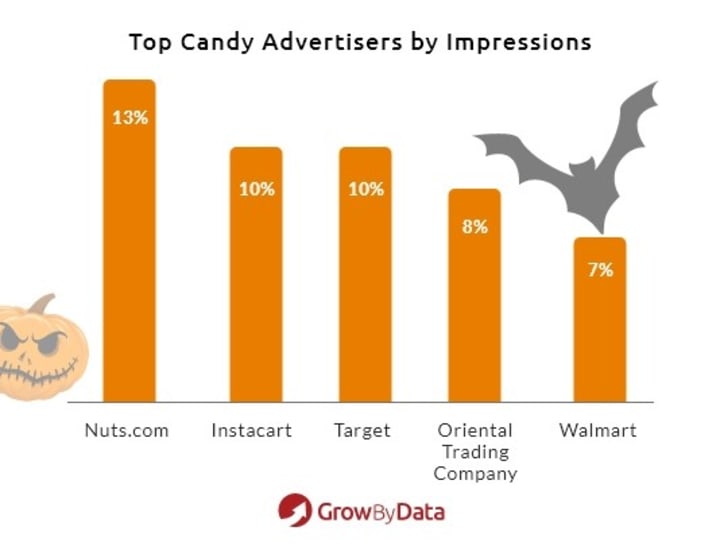
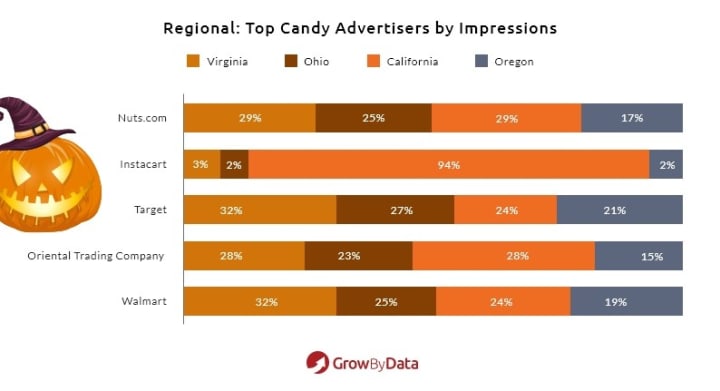
Surprisingly, once again, large online retailers like Amazon, Walmart, and Target are not getting the most ad impressions on Halloween candy-related keywords. The top spot belongs to Nuts.com, receiving 13% of the ad impressions, followed by Instacart and Target with 10% of the impressions each. Oriental Trading Company has 8% of the ad impressions and Walmart 7%, to close out the top 5.
A regional breakdown of the top 5 advertisers is shown below. Instacart jumps out first as they are almost exclusively targeted in California. The least targeted region by the top 5 advertisers is Ohio. Our data also showed 78% of impressions are coming from mobile devices and only 22% are from desktop devices.
3. Top Advertisers based on Number of Products Advertised
Costume:
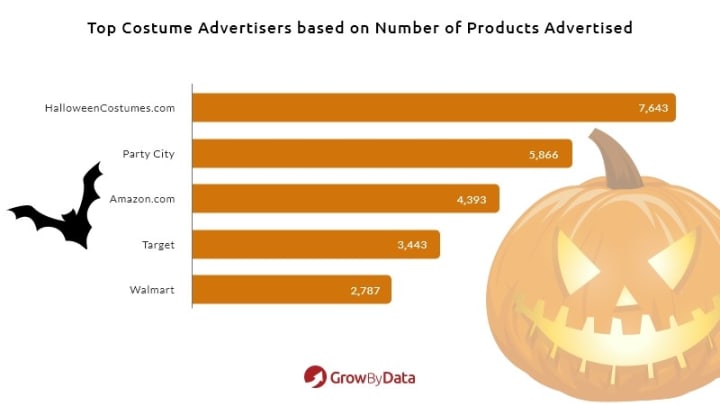
HalloweenCostumes.com seems to be the go-to site for costumes over the past few weeks, receiving 13% of impressions, followed by Party City with 10%. Amazon.com, Target, and Walmart round out the top 5.
Interestingly, HalloweenCostumes.com is more prevalent in eastern states like Virginia and Ohio, while Amazon is more prevalent in the western states of California and Oregon. If you are looking for sales or discounts, HalloweenCostumes.com may be your best option, as they have the highest number of products with sale tags or price drops (16%) of their products.
Candy:
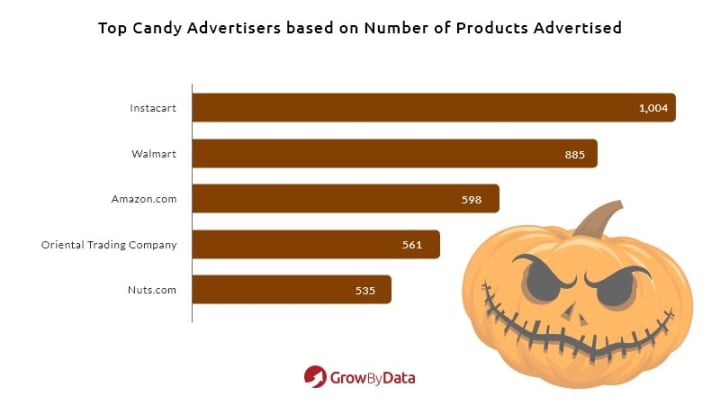
Our data showed Instacart as the store to go to find the most candy options. Instacart is advertising 1004 different products, followed by Walmart with almost 900 different candy products.
Using our Ad Intelligence solution’s capabilities to analyze the contents of the ads, we analyzed which price segments ads were most prevalent. We also analyzed which percentage of ads were utilizing ad extensions, shipping annotations, and local inventory tags. We mentioned in a previous blog on the importance of using these free features and their effect on click-through rates (CTRs), which subsequently affect your quality scores.
4. Ad Impressions based on Price Range
Costume:
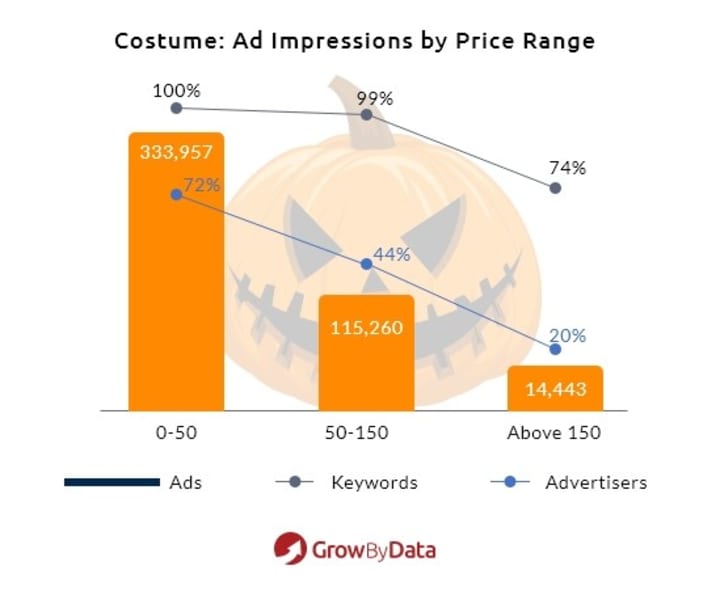
Our data showed 72% of ads were for costumes in the $0-50 price range. Only 3% of the ads were found for costumes over $150. We also found that 72% of advertisers for costumes were also seen competing for ads under the $50 price range. Almost 100% of keywords were seen on ads of products below $150.We also discovered that almost 40% of the ads impressions for products over $150 were coming from Oregon and the least impressions in this range was from Ohio, at only 16%.
Candy:
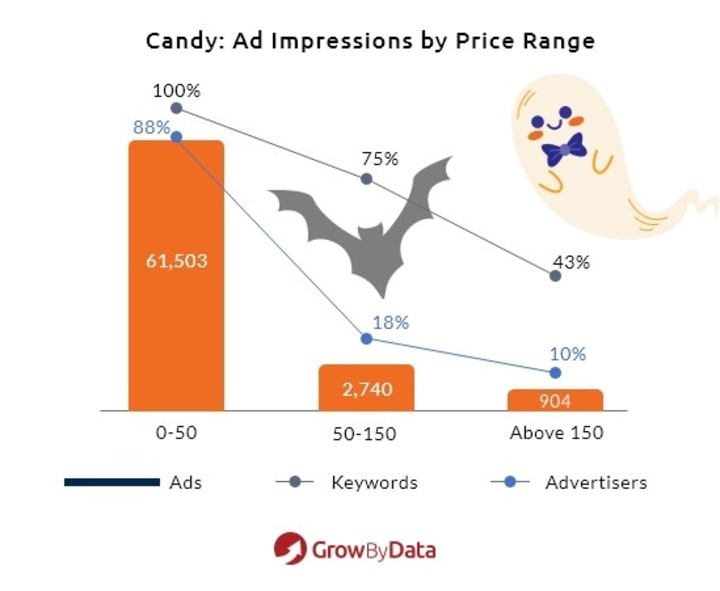
Our data showed 94% of the ads for candy was in the $0-50 price range. This range also captured 100% of the keywords we analyzed. The vast majority (88%) of advertisers were found competing for ads in this price range as well.
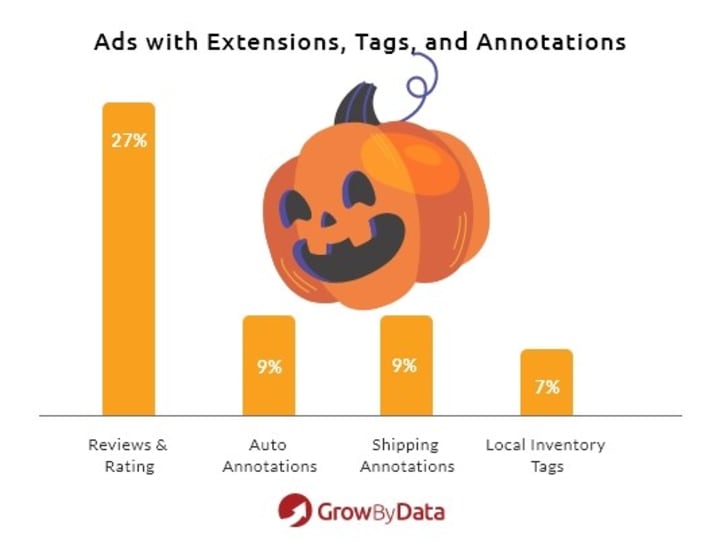
5. Percentage of Ads with Extensions, Tags, and Annotations
Further analyzing the contents of the ads, our data showed 27% of the ads were showing reviews and ratings. 9% of these ads had shipping annotations such as ‘free shipping’, ‘free 3-day’, ‘free 2-day’ etc. Auto-generated annotations like ‘SALE’ and ‘PRICE DROP’ were present on 9% of the ads as well. Local Inventory Tags such as ‘Pickup Today’ and ‘In-Store’ were available on 7% of the ads during this period.
Conclusion
Although we are suffering through a pandemic, the spirit of Halloween seems to be going strong throughout the country. Retailers are doing their best to make the shopping experience a convenient one, by utilizing “free shipping” and “pick up today” features. As your go-to data experts, we will continue to monitor the Halloween costume and candy ad data, to see if the above trends hold, or if they change after Halloween.
About the Creator
Prasanna Dhungel
Managing Partner GrowByData - Marketing Intelligence for Brands & Agencies to Boost Performance
Keep reading
More stories from Prasanna Dhungel and writers in Journal and other communities.
Google Shopping Ad Insights for Health & Beauty
Our experts collected and analyzed the ad data from 327 broad-match type opportunity keywords for the month of January 2021. Using our Search Intelligence Solution, we found a total of 127,737 ads with 10,610 unique ad titles from almost 2K sellers/advertisers. Below are some interesting insights our experts were able to extract from the data. The following Insights include: who were the top advertisers for the month, what range of products were advertised the most, and what kind of ad extensions were used the most during the month.
By Prasanna Dhungel2 years ago in Journal
Did We Manifest AI Due to Collective Human Attitudes on Work?
Food for thought indeed. There is a mighty fine line between "AI is taking our jobs" as a downright conspiracy theory, to something that is true and proven in some (if not many) occupations; from cashiers to illustrators, and robotic surgery to name, let alone robot lawyers for real. Furthermore, this article is not designed to create more fear and uncertainty than what is already circulating in the cosmos, but rather to view AI and the world of work from a different perspective.
By Justine Crowley22 days ago in Journal
Illuminating Crawley: J S Electrician Sheds Light on Professional Electrical Services
Reliability in electrical services is always needed in Crawley, a vibrant town where historical charm and contemporary infrastructure blend together perfectly. To keep the town powered and safe, qualified electricians are essential for tasks including industrial maintenance, commercial installs, and residential wiring. One name sticks out in the middle of this demand: J S Electrician.
By J S Electrician4 days ago in Journal
The Dangling Bead
My life is splashing before my eyes, as I precariously suspend and prepare for the end, the consumption of my Self and identity. I know that gravity will be the victor in this struggle. Like a pendant, slipping from the chain, the tension has caught me in this moment, bestowing one last gift of reflection. I cling desperately, questioning my purpose. Searching for comfort. And I remember…
By Leslie Staven4 days ago in Fiction


Comments
There are no comments for this story
Be the first to respond and start the conversation.