
I Built a Spectrum Analyzer in the Browser and Then Kept Adding Things I Actually Needed
What started as a small browser experiment slowly became a real audio tool with actual users
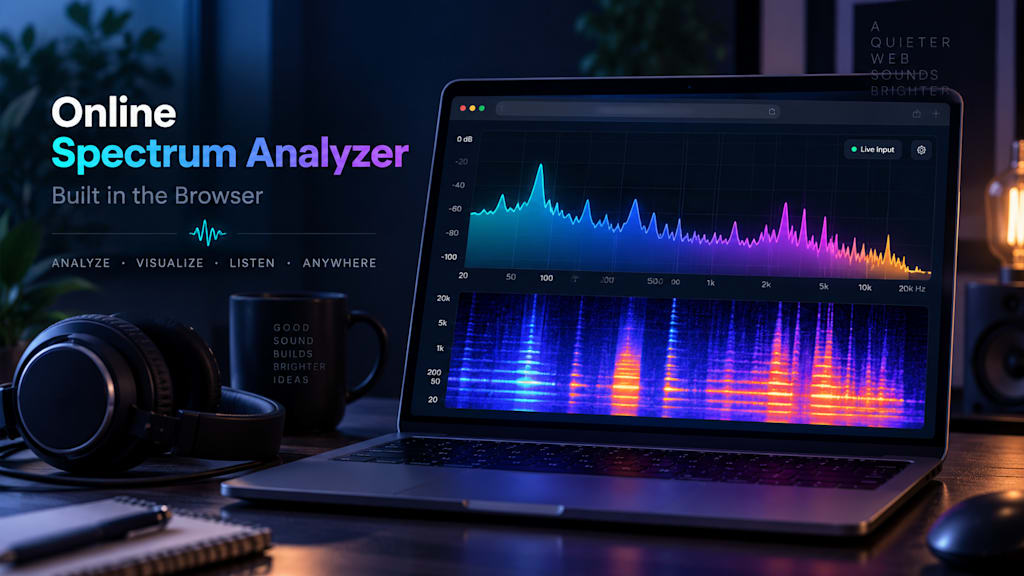
I did not start onlinespectrumanalyzer.com with a detailed product plan. The original idea was much smaller. I had been looking at spectrum analyzer tools and thought the browser should already be capable of doing most of this work locally. I had worked with media-related software before, so the idea of decoding audio, calculating frequency data and drawing it in real time felt like a good small project to try.
The first version was not complicated. I wanted to load an audio file, run the analysis in the browser, draw the frequency spectrum and keep the page responsive. That part worked fairly quickly. What I did not expect was how fast the project would stop feeling “finished.”
A live spectrum is useful, but it also disappears constantly. If a strange sound appears for half a second, the graph changes immediately and the moment is gone. That became annoying when I actually used the tool instead of just looking at it as a programming exercise. I wanted to see what had happened over time, not only what was happening at that exact moment.
That was why I added the spectrogram.
The spectrogram changed the project more than I expected. Suddenly it was possible to see a constant tone continuing across time, a short burst appearing for only a moment, or a wide area of noise instead of a single narrow peak. It made the tool feel less like a Web Audio demo and more like something I could genuinely use to inspect a recording.
I also made a decision fairly early that I did not want normal audio analysis to depend on uploading a file to a server. For a spectrum analyzer, that felt like an unnecessary step. The browser can already decode audio, process frequency data and render the visualizations. Keeping that work on the client side also means I do not need to store somebody’s recording just so they can look at its frequencies.
Later I added microphone analysis. That changed the way I used the site again. With a file, I am examining something that already exists. With microphone input, I can open the page and immediately test whatever is around me. A fan, a speaker, a room, background noise, an instrument or some electronic device can all become input without making a recording first.
This was also when I started thinking less about “features” and more about actual problems people might be trying to solve. If there is a steady hum, is there a strong peak near 50 Hz or 60 Hz? Is there a narrow tone that keeps appearing? Does a noise happen continuously or only at certain moments? A spectrum and a spectrogram together can answer those questions much faster than simply staring at a waveform.
The website is at:
https://onlinespectrumanalyzer.com
After launching it, I started paying attention to where people were actually coming from. The traffic was small, which is normal for a new site, but it was still interesting to see real visitors arrive from places I had not expected. I saw users coming through search, AI referrals and audio-related communities. A post on the Kemper forum, for example, actually sent people to the site. I also noticed traffic from countries like Germany and Japan showing up more often than I expected.
At one point someone even paid for the optional paid part of the site.
It was only one person, so I do not want to exaggerate what that means. The site was still getting only a small number of visitors per day. But seeing a real person decide that the tool was useful enough to pay for was different from watching analytics numbers go up. Until then, most of the project existed in my head as something I was building and testing. That payment was a small reminder that somebody on the other side was actually using it.
I have also been learning that building the analyzer itself and getting people to discover it are two completely different jobs. The technical side is familiar to me. Search traffic, backlinks, forums, browser extensions and distribution are much less predictable. Sometimes a forum link brings two visitors. Sometimes Google shows a page for a keyword I had not thought about. Sometimes almost nothing happens for days.
That part has probably been more educational than I expected.
I recently started comparing the site with older audio tools that already receive a lot of search traffic. One thing became obvious: the successful sites are not only showing a graph. They explain what the graph means. They tell users where low and high frequencies are, what a dominant frequency can indicate, why a 50/60 Hz peak may matter, and when a spectrogram is more useful than a normal spectrum.
That made me rethink what I should build next.
Instead of only adding more controls, I want the tool to become better at helping people understand what they are looking at. A technically correct spectrum is useful, but it is much more useful if a person can open the page and quickly work out whether the strange sound in a recording is hum, noise, clipping, a resonance or something else.
I am still trying to keep the site from becoming too complicated. Audio software can grow into a wall of buttons very quickly. I do not want to recreate a full desktop audio workstation inside a webpage.
The original idea is still the one I like most: open the page, load some audio or turn on the microphone, and learn something useful within a few seconds.
That small idea has already turned into a much bigger project than I expected, and I am still finding new things I want to improve.
Online Spectrum Analyzer: https://onlinespectrumanalyzer.com
About the Creator
Enjoyed the story? Support the Creator.
Subscribe for free to receive all their stories in your feed.
Comments
There are no comments for this story
Be the first to respond and start the conversation.