
Your iPhone Sent Everyone to Siberia for One Night
The -32°C weather bug looked like the apocalypse. It was a broken data chain.
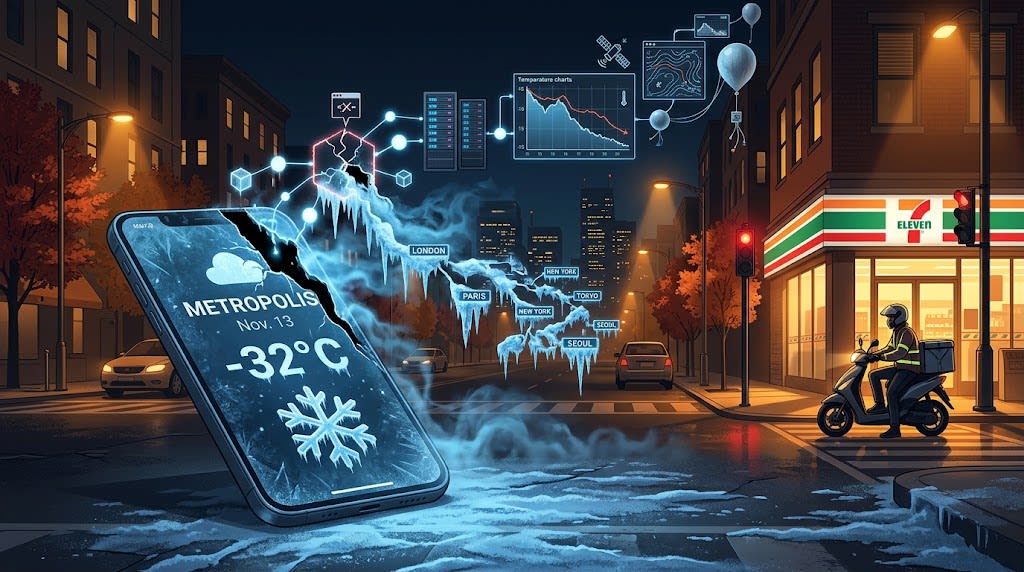
At midnight on Nov. 4, Ms. Li in Chaoyang District, Beijing, opened the iPhone Weather app before bed. She wanted to know whether to wash her car on Friday. The screen showed Nov. 13 with a low of -32°C.
She froze, took a screenshot, and sent it to a group chat: “Has Apple gone crazy?”
At the same time, iPhone users in Kaifu District in Changsha, Xiaoshan District in Hangzhou, Shushan District in Hefei, and Suzhou Industrial Park saw almost the same number: -31°C, -32°C, -28°C. Actual temperatures in these places were different, but the Friday low looked like it had been issued a Siberian residency permit. Shanghai was stranger still. The same day showed a high of 23°C and a low of -31°C. That is a 54°C swing in one day, close to the 1916 record in Browning, Montana, where the temperature fell from 44°F to -56°F, about 55.6°C.
The National Meteorological Center forecast for the same period had most of these places in the teens Celsius. Netizens lit up. “Reborn nine days before the cold-wave apocalypse,” one wrote. “Better start building a shelter and stockpiling supplies.” Some stayed up writing rebirth-apocalypse fiction. Others picked shelters by zodiac sign. A weather-app bug had supplied Chinese social media with a night of material.
Apple quietly fixed the bug. It also left a question: why would the weather app of a top global tech company go mad on the same forecast?
Two easy explanations fail
The first explanation is a Fahrenheit and Celsius mix-up. Take Shanghai. Friday’s low was 17°C. Treat it as 17°F and convert: (17 - 32) / 1.8 ≈ -8.3°C. That does not reach -31°C. Temperatures also varied by city, so conversion results should have varied too. Yet Chaoyang in Beijing, Kaifu in Changsha, Xiaoshan in Hangzhou, and Shushan in Hefei all showed the same number in the Friday low column. The problem was not unit conversion. It was some unified data-processing step.
The second explanation is that the data was matched to another part of the world. Some people cited Yakutsk, Russia, where the average November daily low is about -34°C. That is close to -31°C, as if everyone had been relocated to Siberia. But Shanghai’s high that day was still 23°C. If the whole dataset had switched to Yakutsk, the high should also have been in the minus twenties. Only the low was broken. Apple customer service later denied the “location jumped to Siberia” claim for the same reason: a real location drift would have affected nearby days too, not just one day and only the low temperature.
The main suspect: a daily low hijacked by a garbage value
Since iOS 16, Apple Weather’s 10-day forecast can be expanded by the hour. The “daily low” users see is likely not taken from a “daily low” field. It is probably calculated by taking the minimum of that day’s hourly forecast. In code terms, it is a min().
min() has one weakness. If one garbage value gets into the 24 hourly numbers, the final result is hijacked by it. That same garbage value has no effect on max(). This fits the contradictory “low -31°C, high 23°C” combination. The high was clean. The low was dragged off course by one anomalous point.
The date also matters. Counting from Nov. 4 inclusive, the 10th day is Nov. 13, the last day of the 10-day forecast. The tail end of a data sequence is where programs often fail. If the last few hours of data had not arrived and needed default fill values, one bad default could make every city show the same doomsday low. That explains why the lows were not varied but clustered around the same number.
The science blogger @Fengyun Mengyuan offered a more specific clue. The anomalous low temperatures were concentrated around 20:00 on Nov. 13. Beijing time 20:00 is an important node for numerical model forecasts. He speculated that the forecast data for that moment had a serious deviation, which an interpolation algorithm turned into a sharp low-temperature spike. The entire data source may not have been wrong. One anomalous value at a key node may have contaminated the statistical chain.
The bug is less interesting than the missing validation
Technically, an interpolation error, a default fill value, or one anomalous node is enough to create this mess. The harder question is why data so obviously contrary to common sense reached users at all.
Apple Weather’s forecast data mainly comes from third-party providers. Extreme weather information for mainland China is provided by QWeather. Data conversion across regions, standards, and providers is already fragile. More importantly, the system appears to lack common-sense validation for local climate. A data point like “Shanghai -32°C in November” should be intercepted by any system that understands the local climate. It was not. It was included in the daily low, displayed in the 10-day forecast, and seen by users nationwide.
Apple customer service concluded that the cause was a “system port anomaly,” not a phone hardware failure, and said the technical team had fixed it. That statement names the faulty link but does not disclose a detailed technical cause. The analysis above is therefore reasonable speculation based on public information. Even without identifying the exact line of code, the conclusion is clear: a weather app is not a meteorological bureau. It is a data-processing product. If any link fails, whether data source, interpolation, statistics, or validation, the forecast turns into a fable.
This is not Apple’s first fire-and-ice event
In June, Apple Weather forecast over 50°C for Lin’an in Hangzhou. The Lin’an District Meteorological Bureau debunked it. Five months later, the app froze large parts of the country to -30°C. Within one year, users got doomsday fire and doomsday ice. Some dark-circle-eyed programmer probably lost a chicken drumstick from dinner.
For a writer, this is more than a programmer joke. It offers three angles.
The technical angle: how a min(), a fill value, and a 20:00 forecast node created a nationwide “doomsday cold wave.” This suits science writing and product analysis.
The product angle: a weather app competes not only on where its data comes from, but on whether bad data can be stopped. A global product without local validation will crack in everyday use. This suits product commentary and tech-company governance.
The communication angle: why did everyone’s first reaction become apocalypse fiction? Extreme data is narrative by nature. A bug can ignite user-generated content. It also reminds brands that bad data is not just an error. Users will consume it as content. This suits media, PR, and social-media observation.
Back to that midnight
At midnight on Nov. 4, after taking the screenshot, Ms. Li glanced out the window. Beijing’s autumn night wind was normal. The convenience store downstairs was still lit. A delivery rider in a thin jacket waited at the red light. She put down her phone, muttered “what lousy weather,” and rolled over to sleep.
The next day, the forecast was normal. Nov. 13 in Beijing: cloudy, 8°C to 17°C. The -32°C remained only in screenshots and jokes, like a collective hallucination.
But that midnight happened. On countless iPhone screens, the same absurd number lit up at the same time. The weather app we check every day sits at the end of a long data chain: third-party data, interpolation algorithms, statistical functions, validation rules, and display logic. If one link dozes off, users see a cyber apocalypse instead of weather.
Apple fixed this bug. The next time a default fill value, an anomalous node, or a missing validation rule appears, users will probably still take a screenshot, write a post, and ask: is this weather, or a programmer’s dream?
About the Creator
Jin
Writer of reamstories
https://reamstories.com/jin
Enjoyed the story? Support the Creator.
Subscribe for free to receive all their stories in your feed. You could also become a paid subscriber, letting them know you appreciate their work.
Comments
There are no comments for this story
Be the first to respond and start the conversation.