
Why 5M1E Still Runs Every Serious Factory, Fifty Years After It Was Invented
Most failures aren’t one cause — they’re two or three forces pushing together. Here’s how to see it before the defect appears.
Walk into almost any manufacturing plant and ask someone to explain why a batch went bad, and you'll get an answer within ten seconds. It's usually a name, a machine number, or a supplier. “The new guy was on shift.” “That press has been acting up.” “The vendor swapped material again.” These answers feel complete. They are rarely correct.
Here's the tension worth sitting with: manufacturers have spent decades training people on a framework — 5M1E — that exists specifically to stop this kind of fast, comfortable, wrong answer. Everyone has seen the six letters on a training slide. Almost nobody uses them the way they were designed to be used. And the gap between “knowing the framework” and “using the framework correctly” is where a huge amount of preventable quality cost quietly disappears every year.
This piece is about closing that gap. Not by reciting what Man, Machine, Material, Method, Environment, and Measurement stand for — you already know that — but by explaining what 5M1E actually does inside a production system, why the obvious way of using it fails, and what a working version looks like in practice.
Part 1 — What 5M1E Actually Is (Once You Strip the Buzzwords)
5M1E is a root‑cause categorization model used in manufacturing and quality management to sort the possible causes of a process problem into six buckets: Man, Machine, Material, Method, Environment, and Measurement. It's the backbone of fishbone (Ishikawa) diagrams, 8D reports, and most formal root‑cause‑analysis templates used across automotive, electronics, and process manufacturing.
That's the textbook definition. It's accurate, and it's almost useless on its own, because it describes the shape of the tool without describing what it's for.
Here's the version that actually matters: 5M1E is not a list of six things that exist in a factory. It's a model of six independent sources of variation that feed into a single output: the product coming off the line. Every one of those six categories can drift, quietly, in ways that don't trip an alarm, don't stop the line, and don't show up until the accumulated drift crosses a threshold and the product fails.
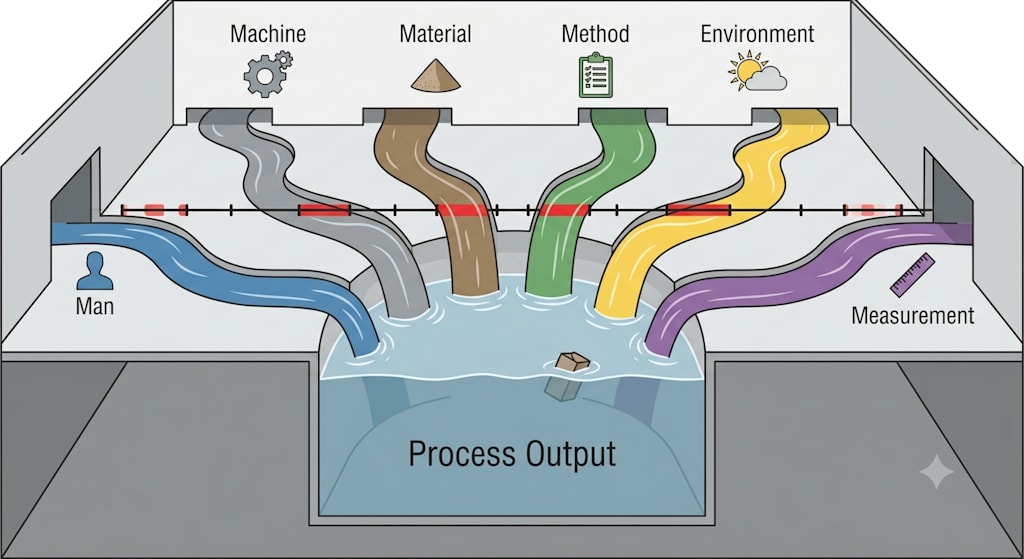
Think of it less like a checklist and more like six separate rivers feeding into one reservoir. The reservoir is your process output — dimensions, strength, appearance, safety, whatever the customer is actually paying for. Each river can rise or fall independently: a person gets tired, a bearing wears, a resin batch shifts hardness, a procedure gets skipped under time pressure, humidity climbs on a summer afternoon, a gauge drifts out of calibration. None of these events, by itself, floods the reservoir. But rivers rise together more often than intuition suggests, and when several rise at once, the water goes over the wall, and it looks, from the outside, like a single sudden failure.
That's the real definition. 5M1E is a variance‑tracking model disguised as a category list.
Part 2 — Why This Matters More Now, Not Less
There's a lazy argument floating around manufacturing circles: “Now that we have MES, IoT sensors, and AI‑driven quality prediction, do we still need a 1970s‑era framework built for a pre‑digital shop floor?”
The honest answer is that digitization has made 5M1E more necessary, not less, for a structural reason that's easy to miss.
Digital systems are extremely good at collecting facts. They are not automatically good at organizing those facts into causal structure. A modern plant with an MES, a WMS, an IoT‑connected fleet of machines, and a quality database can generate millions of data points a day and still have zero improvement in defect rates, because data volume and causal clarity are not the same thing. Someone — or something — still has to decide which variables to compare, which correlations are meaningful, and which category of the system produced the drift. That decision structure is exactly what 5M1E provides.
There's also a harder, more uncomfortable reason this matters right now: supply chains have gotten less stable, not more. Material substitutions happen more frequently as procurement chases cost and lead‑time targets. Labor turnover has increased across most manufacturing economies post‑2020, meaning “Man” variation is structurally higher than it was a decade ago. Equipment fleets are aging in many mature manufacturing bases even as automation investment grows unevenly across sectors. Every one of the six M's is under more pressure than it used to be, at the exact moment when product tolerances (especially in EV batteries, semiconductors, and precision electronics) have gotten tighter. The framework isn't outdated — the conditions it was built to catch have intensified.
Part 3 — How It Actually Works (The Real Mechanism)
This is the part most training decks skip, and it's the part that actually explains why some teams get real value out of 5M1E while others just fill out a form.
The mechanism is to isolate which variable moved, and when. Categorizing the cause is a byproduct, not the goal.
A defect is a lagging indicator. By the time you see a bad part, the causal chain that produced it may have started hours, days, or weeks earlier. The job of 5M1E, done correctly, is to work backward from the defect through a specific sequence:
Step 1: Establish what “normal” looked like before the defect appeared.
You cannot detect drift without a baseline. This is where Statistical Process Control (SPC) intersects directly with 5M1E: SPC's entire purpose is distinguishing “common cause” variation (the normal noise every process has) from “special cause” variation (a signal that something specific changed). Without a documented baseline for each of the six M's — normal cycle time, normal tool wear curve, normal incoming material spec range, normal humidity band — you have no way to tell drift from noise.
Step 2: Timeline every candidate variable, not just the obvious one.
The instinct is to check the variable that's easiest to blame (usually Man). The correct move is to lay out, on the same timeline, when each of the six categories last changed: last shift change, last maintenance cycle, last material batch receipt, last SOP revision, last environmental control adjustment, last calibration check. You're looking for temporal overlap, not the loudest suspect.
Step 3: Look for compounding, not causation from a single M.
This is the mechanism most people get wrong. In the vast majority of real manufacturing failures investigated in depth, the answer isn't one M — it's two or three M's shifting in the same window, each individually within tolerance, together pushing the process outside its stable window. A material batch with slightly higher hardness, combined with a machine running slightly past its maintenance interval, combined with a process parameter tweaked for cycle‑time improvement — none of these alone causes a defect. Stacked, they compress the process window until normal variation starts producing scrap.
Step 4: Verify with data, not narrative.
This is where Measurement Systems Analysis (MSA) becomes the silent gatekeeper of the whole exercise. If your measurement system itself has more variation than the process you're trying to diagnose, every conclusion from steps 1–3 is unreliable. You can misdiagnose a stable process as unstable — or worse, miss real drift — simply because the gauge, the inspector, or the sampling method introduces noise that gets mistaken for process signal.
The organizational layer: who holds what kind of control
Underneath the technical mechanism, there's a control‑allocation structure that most training material never makes explicit, and it's worth naming directly, because it explains why 5M1E succeeds in some plants and becomes theater in others.
At any moment, responsibility for each of the six M's sits with a different level of the organization, and each level has a different failure radius if it gets something wrong:

The reason “find the responsible person” thinking fails is that it collapses this five‑layer structure into one layer — usually the operator — even when the actual point of control sat somewhere else. An operator cannot fix a supplier's hardness variance. A team leader cannot fund a predictive‑maintenance sensor package. When you blame the layer that had the least control over the variable that actually moved, you don't just fail to fix the problem; you actively train the organization to hide the next early signal, because reporting it produces punishment rather than resolution.
Part 4 — What Most People Get Wrong About 5M1E
Misconception 1: “5M1E is a way to find who's responsible.”
It's the opposite. Every serious quality methodology built on top of 5M1E, including Toyota's andon system, TPM, and 8D, is explicitly designed to move the investigation away from individual blame and toward system conditions, because individual blame produces a one‑time fix while system correction prevents recurrence. Toyota's own management literature frames this as distinguishing “respect for people” from “tolerance for defects” — the two are not the same thing, and confusing them is exactly how plants end up disciplining operators for problems the operators had no power to prevent.
Misconception 2: “If we just check all six categories, we've done a proper analysis.”
Checking six boxes is not the same as finding a causal chain. A huge number of 8D reports and fishbone diagrams look thorough and change nothing, because the team lists possible causes under each M without ever testing which ones actually moved in the relevant time window. Breadth without a timeline is decoration, not diagnosis.
Misconception 3: “Measurement is the easy category — it's just checking numbers.”
This is backwards. Measurement is usually the category most likely to be silently broken, because nobody suspects the ruler. If two inspectors get different readings on the same part, or if a gauge hasn't been recalibrated in the interval it should have been, every other conclusion drawn from that data is built on sand. MSA (measurement system analysis) exists precisely because “the data says so” is only as trustworthy as the system that produced the data.
Misconception 4: “More data automatically means better diagnosis.”
A plant with MES, IoT sensors, and full digital traceability can still misdiagnose problems if the underlying process isn't standardized and the data isn't structured around causal categories. Digitizing chaos produces well‑documented chaos, not clarity. The mechanism described in Part 3 (timeline, isolate, compound, verify) has to exist whether the data comes from a paper logbook or a real‑time dashboard. The dashboard just makes Step 1 (establishing baseline) faster, not automatic.
Misconception 5: “SOPs solve the Method category once they're written.”
A written SOP that nobody follows, or that's out of date relative to current best practice on the floor, isn't a control — it's a liability, because it creates the illusion of standardization during an audit while the real operating method drifts unrecorded. The gap between “documented method” and “executed method” is itself a source of unmeasured variation, and it belongs inside the Method category's own risk register, not outside it.
Part 5 — My Judgment: 5M1E's Real Value Has Shifted, Not Disappeared
Here's where I'll draw a line rather than hedge across every possible position.
I think 5M1E's categorization function — the six labels — has become close to a commodity. Every quality engineer knows the six letters. That part of the framework isn't where competitive advantage lives anymore, and treating “we use 5M1E” as a meaningful capability claim is close to meaningless in 2026.
What has not become a commodity, and what actually separates strong plants from mediocre ones, is the discipline underneath the labels: the timeline reconstruction, the willingness to look for compounding causes instead of a single scapegoat, and the infrastructure to verify measurement reliability before trusting any conclusion. That discipline is organizational, not technical. You cannot buy it as software. MES and IoT platforms can accelerate the mechanism — faster baselines, faster timeline reconstruction, faster anomaly flagging. But they cannot substitute for a plant culture that asks “why did the system allow this” instead of “who did this.”
I'd also push back on a narrative I see increasingly in AI‑and‑manufacturing commentary: that predictive models will eventually replace the human causal reasoning that 5M1E requires. I don't think that's where this is heading, at least not soon. AI models are good at flagging correlation, like “vibration in Machine X correlates with dimensional drift in Product Y,” but the leap from correlation to an actionable causal story still requires domain judgment about mechanism (why would that vibration frequency specifically affect that dimension?). The realistic near‑term trajectory is AI‑assisted correlation detection feeding into human‑led causal reasoning, not autonomous root‑cause resolution. Anyone selling a platform that claims full automation of this step is overselling it.
Part 6 — What This Actually Changes on the Floor
If you accept the mechanism described above, several concrete practices follow, and they're the ones that separate plants that improve from plants that just generate reports.
Build a rolling baseline for each of the six M's, not just for final product specs: normal cycle time range, normal incoming material variance, normal environmental band, so drift has something to be measured against.
Timestamp every change: shift handovers, maintenance events, material batch receipts, SOP revisions, calibration checks. Without a shared timeline, step 2 of the mechanism is impossible.
Treat “no single M explains this” as the default expectation for complex quality events, not a dead end. Most real failures are compounding, and the investigation should be designed to find combinations, not a single villain.
Audit your measurement system before trusting your process data. If two people measuring the same part get different numbers, fix that first; every other conclusion downstream is unreliable until this is resolved.
Separate detection from diagnosis organizationally. Give operators and sensors the job of flagging early signals (cheap, fast, low‑stakes); reserve deep causal investigation for engineering and cross‑functional teams once a real signal is confirmed. Don't make operators responsible for causal conclusions they don't have the authority or data access to reach.
One useful gut check for whether an organization's 5M1E practice is real or theater: ask what happened the last time an investigation concluded “it wasn't one clear cause, it was three things stacking.” If that answer makes people uncomfortable, or if the plant's default output is always a single named cause and a single corrective action, the framework isn't being used as designed; it's being used to produce a fast, defensible‑looking answer, which is a different goal entirely.
Conclusion: The One Idea Worth Keeping
Strip away the six letters, the fishbone diagrams, and the audit checklists, and 5M1E reduces to one operating principle: a production system is stable only as long as six independent sources of variation stay inside their windows, and most failures happen when two or three of those windows compress at the same time without anyone noticing the overlap.
The mental model to carry forward isn't “check Man, Machine, Material, Method, Environment, Measurement.” It's this: when something goes wrong, resist the first explanation that arrives, build a timeline of what actually changed across all six categories in the relevant window, check whether your measurement of the problem is itself trustworthy, and look specifically for compounding rather than a single cause. That sequence, not the acronym, is the actual tool. The acronym is just the label on the box it comes in.
A concept map showing the six M's as independent “rivers” of variation feeding into a single reservoir labeled “process output” — this visualizes the core reframing in Part 1 (that 5M1E tracks six sources of drift, not six departments), and without it, readers tend to default back to seeing the six letters as static categories rather than moving variables.
A horizontal timeline diagram showing simultaneous tracks for Man, Machine, Material, Method, Environment, and Measurement, with a vertical marker at the point a defect appeared and a highlighted overlapping zone where two tracks shifted just before that point — this anchors Part 3's core mechanism (isolate‑then‑check‑for‑compounding) and without it, the “timeline reconstruction” concept stays abstract instead of showing what an actual investigation grid looks like.
A side‑by‑side comparison panel: left side labeled “Common failure pattern” showing a single arrow from “defect” to “one blamed cause” to “one fix”; right side labeled “Working 5M1E pattern” showing multiple converging arrows from several M categories into “defect” and branching into “multiple system corrections” — this visualizes Misconceptions 1 and 2 in Part 4, and without it, the distinction between blame‑based and system‑based analysis remains a verbal claim rather than a visible structural contrast.
A five‑row organizational responsibility ladder (matching the table in Part 3) showing Operator, Team Leader, Engineering, Procurement, and Plant Management with icons indicating what each layer controls and the size of the failure radius if that layer's control point is missed — this makes the “control‑allocation” argument in Part 3 concrete, and without it, the claim that blame often lands on the wrong organizational layer is hard to visualize as a structural mismatch rather than just an opinion.
A simple decision flowchart titled “What to do when a defect appears,” starting at “defect detected,” branching through “check measurement system reliability,” “build six‑M timeline,” “check for single vs. compounding cause,” and ending in two outcome boxes: “single fix” vs. “system‑level correction” — this operationalizes the conclusion's guidance into a concrete path, and without it, the article's closing advice risks staying conceptual instead of giving readers a concrete sequence to apply on their next investigation.
About the Creator
Jin
Writer of reamstories
https://reamstories.com/jin
Enjoyed the story? Support the Creator.
Subscribe for free to receive all their stories in your feed. You could also become a paid subscriber, letting them know you appreciate their work.
Comments
There are no comments for this story
Be the first to respond and start the conversation.