
Web App Performance Optimization
Discover the essentials of web app performance optimization. Build responsive and reliable web applications.


Sluggish web applications tend to frustrate users in subtle but significant ways. Consequently, enhancing web app performance transcends mere technical maintenance; it is a blend of user experience design, engineering rigor, and safeguarding business interests. When an application operates smoothly and swiftly, it fosters user confidence. Conversely, sluggishness drives users to seek shortcuts or, more critically, switch to competing services.
This resource explores the tangible aspects of achieving speed and reliability: identifying key performance indicators, establishing effective testing protocols, determining post-deployment monitoring strategies, and pinpointing areas where teams can achieve the most significant improvements.
What Does Web App Performance Optimization Entail?
This process involves the continuous effort to accelerate loading times, improve responsiveness, ensure stability, and optimize resource consumption within a web application.
While this concept appears straightforward, its practical application is multifaceted. It encompasses frontend development, server latency, database efficiency, caching mechanisms, media assets like images and fonts, external scripts, hosting infrastructure, mobile compatibility, and even aesthetic choices. A visually appealing interface burdened by large, unoptimized images can still deliver a poor experience. Similarly, a well-structured backend paired with an oversized JavaScript package can lead to user dissatisfaction.
The crucial aspect here is continuity. Performance enhancement is not a one-time fix to be completed and forgotten. New functionalities increase complexity, traffic patterns shift, browsers evolve, and the addition of marketing trackers can suddenly degrade page speed significantly.
Effective optimization focuses on identifying where improvements in speed, reliability, and usability directly impact the real-world experience of individuals using the product.
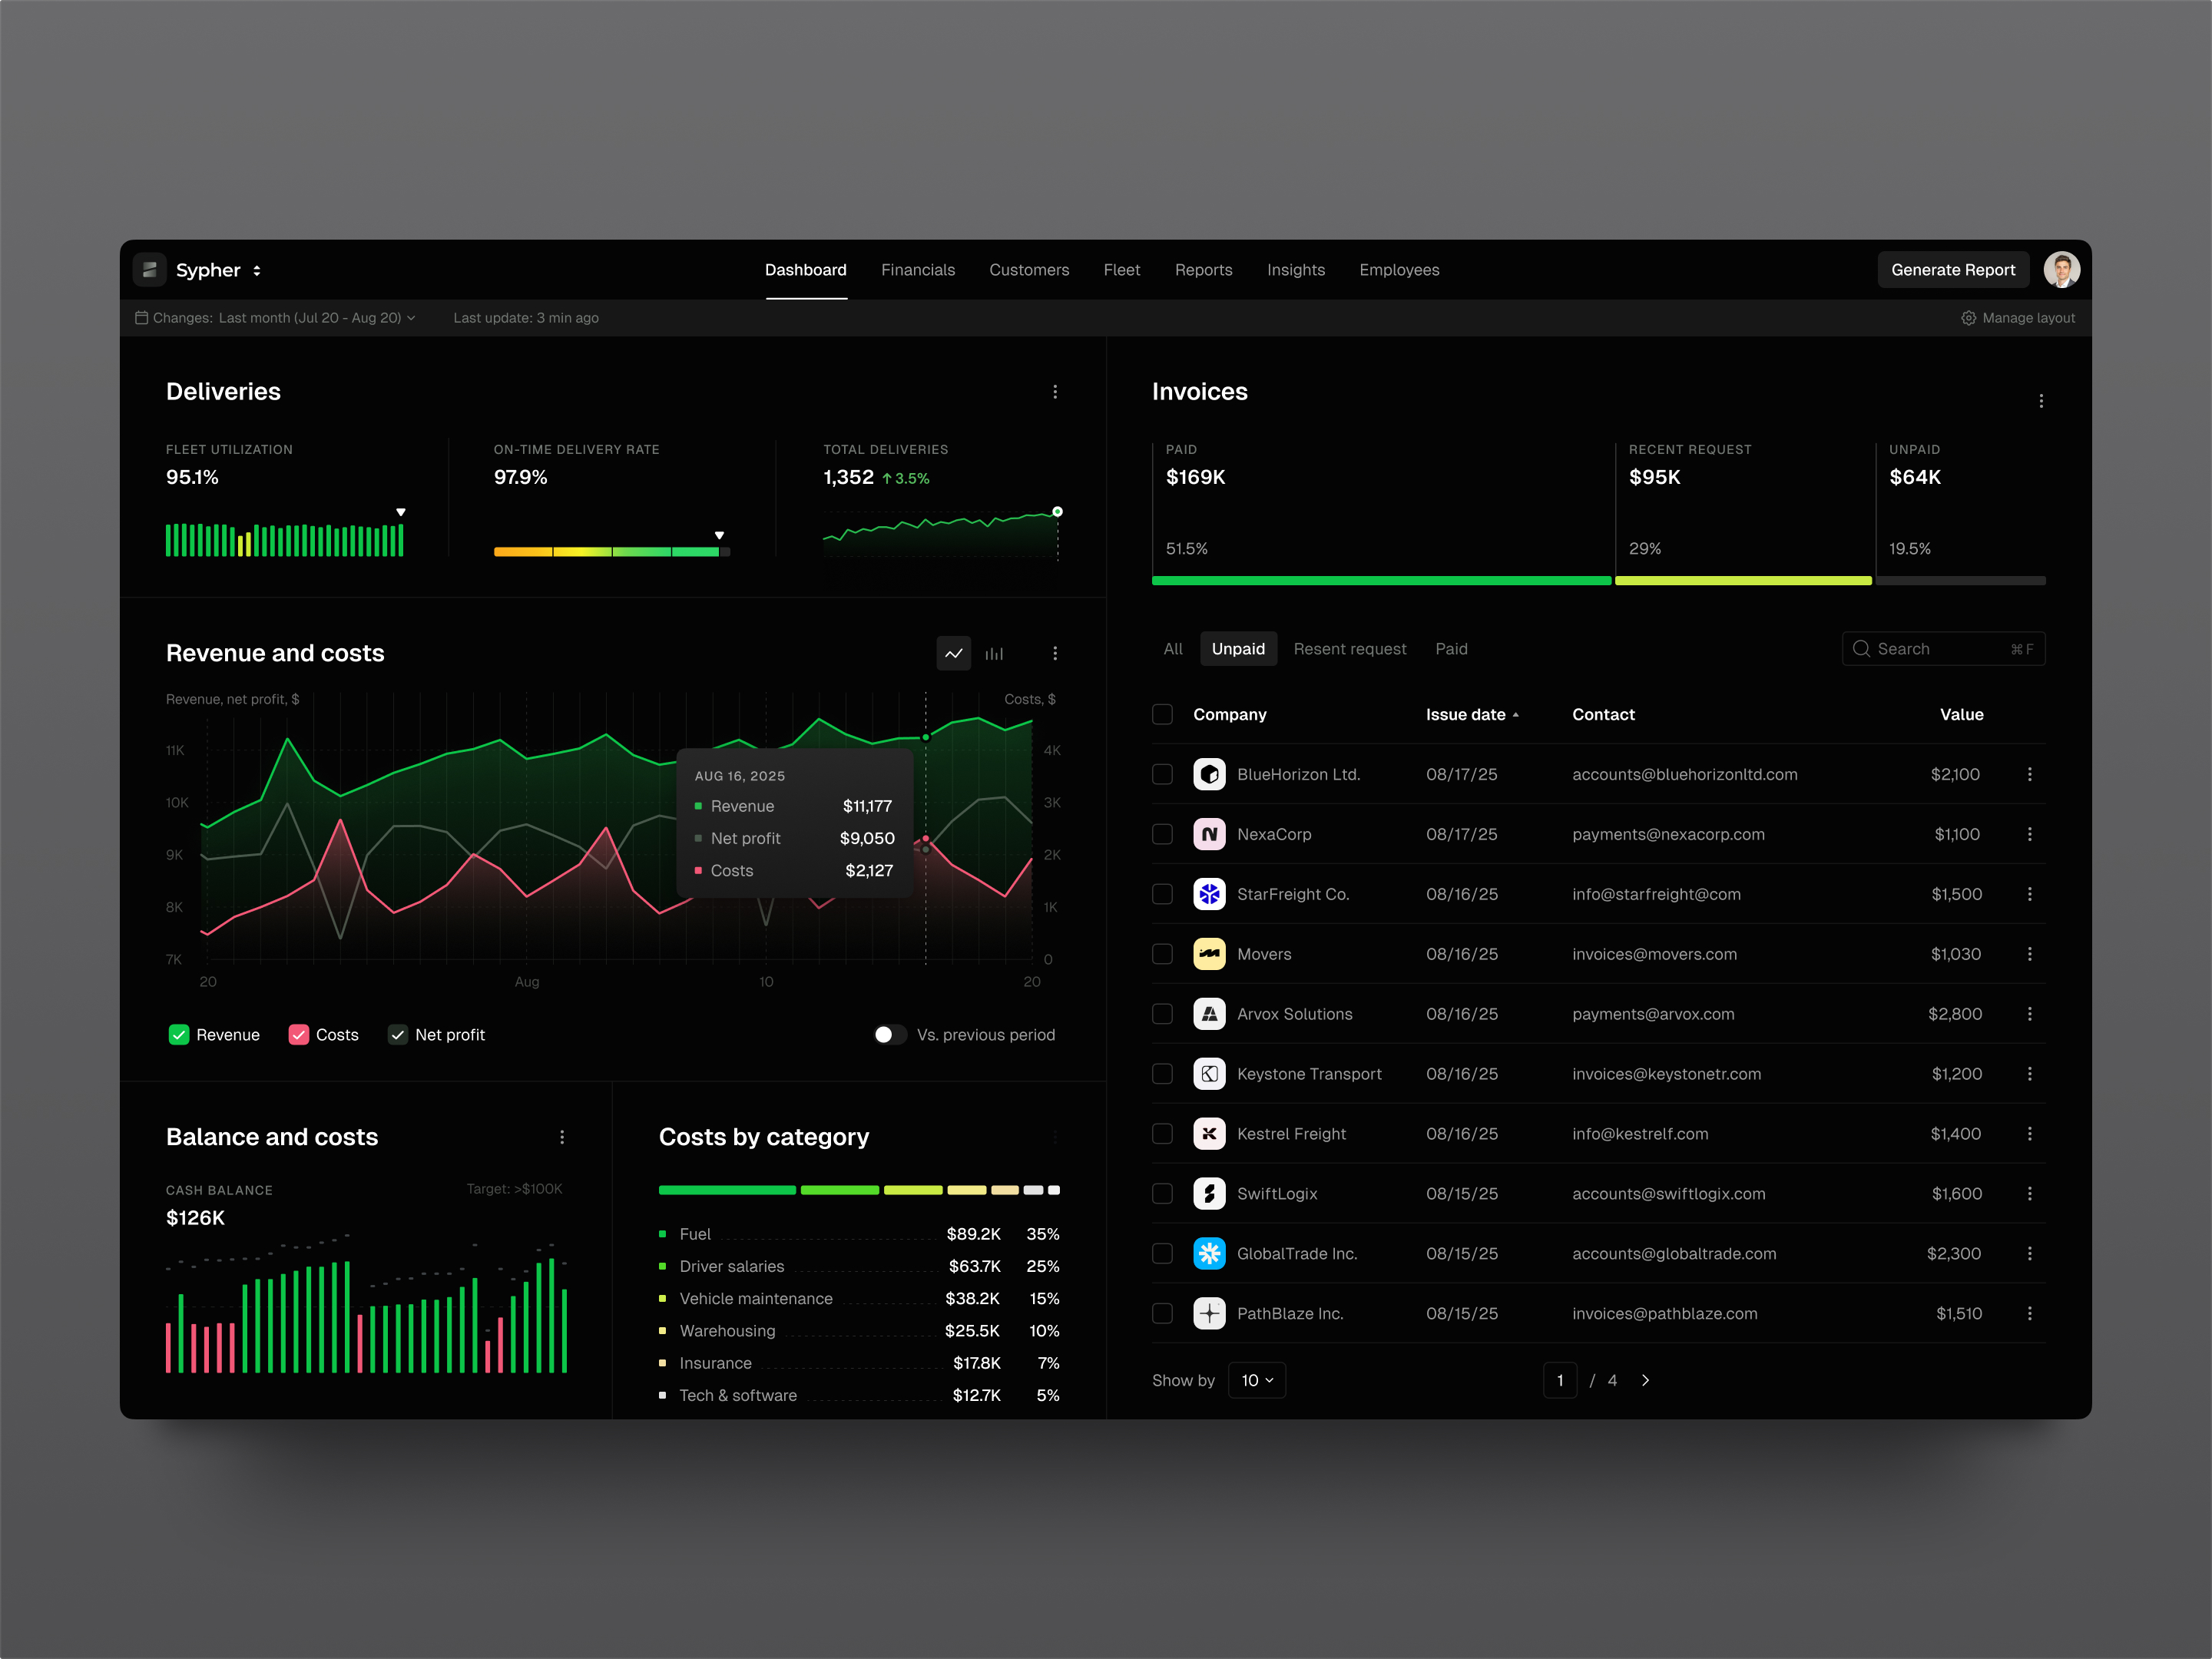
Essential Performance Indicators for Web Applications
Before attempting any fixes, you need concrete data. Without it, "sluggish" becomes a subjective term that means something different to everyone in the room.
Appropriate metrics transform vague grievances into actionable items that can be analyzed, prioritized, and enhanced. Some indicators are purely technical, while others align more closely with product analytics. Both categories are essential.
Core Web Vitals
Core Web Vitals serve as an excellent foundation because they bridge the gap between technical performance and user experience.
- Largest Contentful Paint (LCP): This metric indicates how long it takes for the primary content to appear on screen. If your main dashboard, hero section, or product listing takes an excessive amount of time to load, LCP will highlight this issue.
- Interaction to Next Paint (INP): This measures responsiveness. It captures a very human experience: clicking a button and waiting in silence before anything occurs. Such delays create a poor impression.
- Cumulative Layout Shift (CLS): This tracks visual stability. If an advertisement or image loads unexpectedly and shifts a "Buy" button just as a user attempts to click it, the result is not merely irritating—it erodes trust.
Frontend Indicators
Frontend metrics reveal what is occurring within the browser. Key areas to monitor include Time to First Byte, First Contentful Paint, JavaScript execution duration, bundle size, hydration time, image file sizes, and font loading patterns.
From my perspective, teams frequently underestimate the impact of JavaScript weight. A single dependency can quickly multiply into three, then ten. Consequently, the application delivers a heavy bundle to every user, including those on weak mobile connections in locations with poor Wi-Fi. This scenario is more common than many acknowledge.
Backend and Infrastructure Data
The backend provides its own set of insights: API latency, throughput capacity, error rates, database query durations, cache hit ratios, queue processing times, CPU utilization, memory constraints, and server saturation levels.
Even a perfectly optimized frontend will feel sluggish if the API requires two seconds to respond. Furthermore, average response time is insufficient. Beyond standard metrics, examine percentiles, particularly p95 and p99. Users are unconcerned if the average request is fast if their specific request is among the slowest.
Product and Business Outcomes
Performance must also be linked to tangible results. Monitor conversion rates, bounce rates, task completion success, user retention, trial activations, cart abandonment rates, or any other key performance indicators relevant to your product.
This is where speed transitions from being solely a developer’s concern. If accelerating the onboarding process helps more users reach their "aha" moment, it is not just a technical enhancement—it is a strategic product improvement.
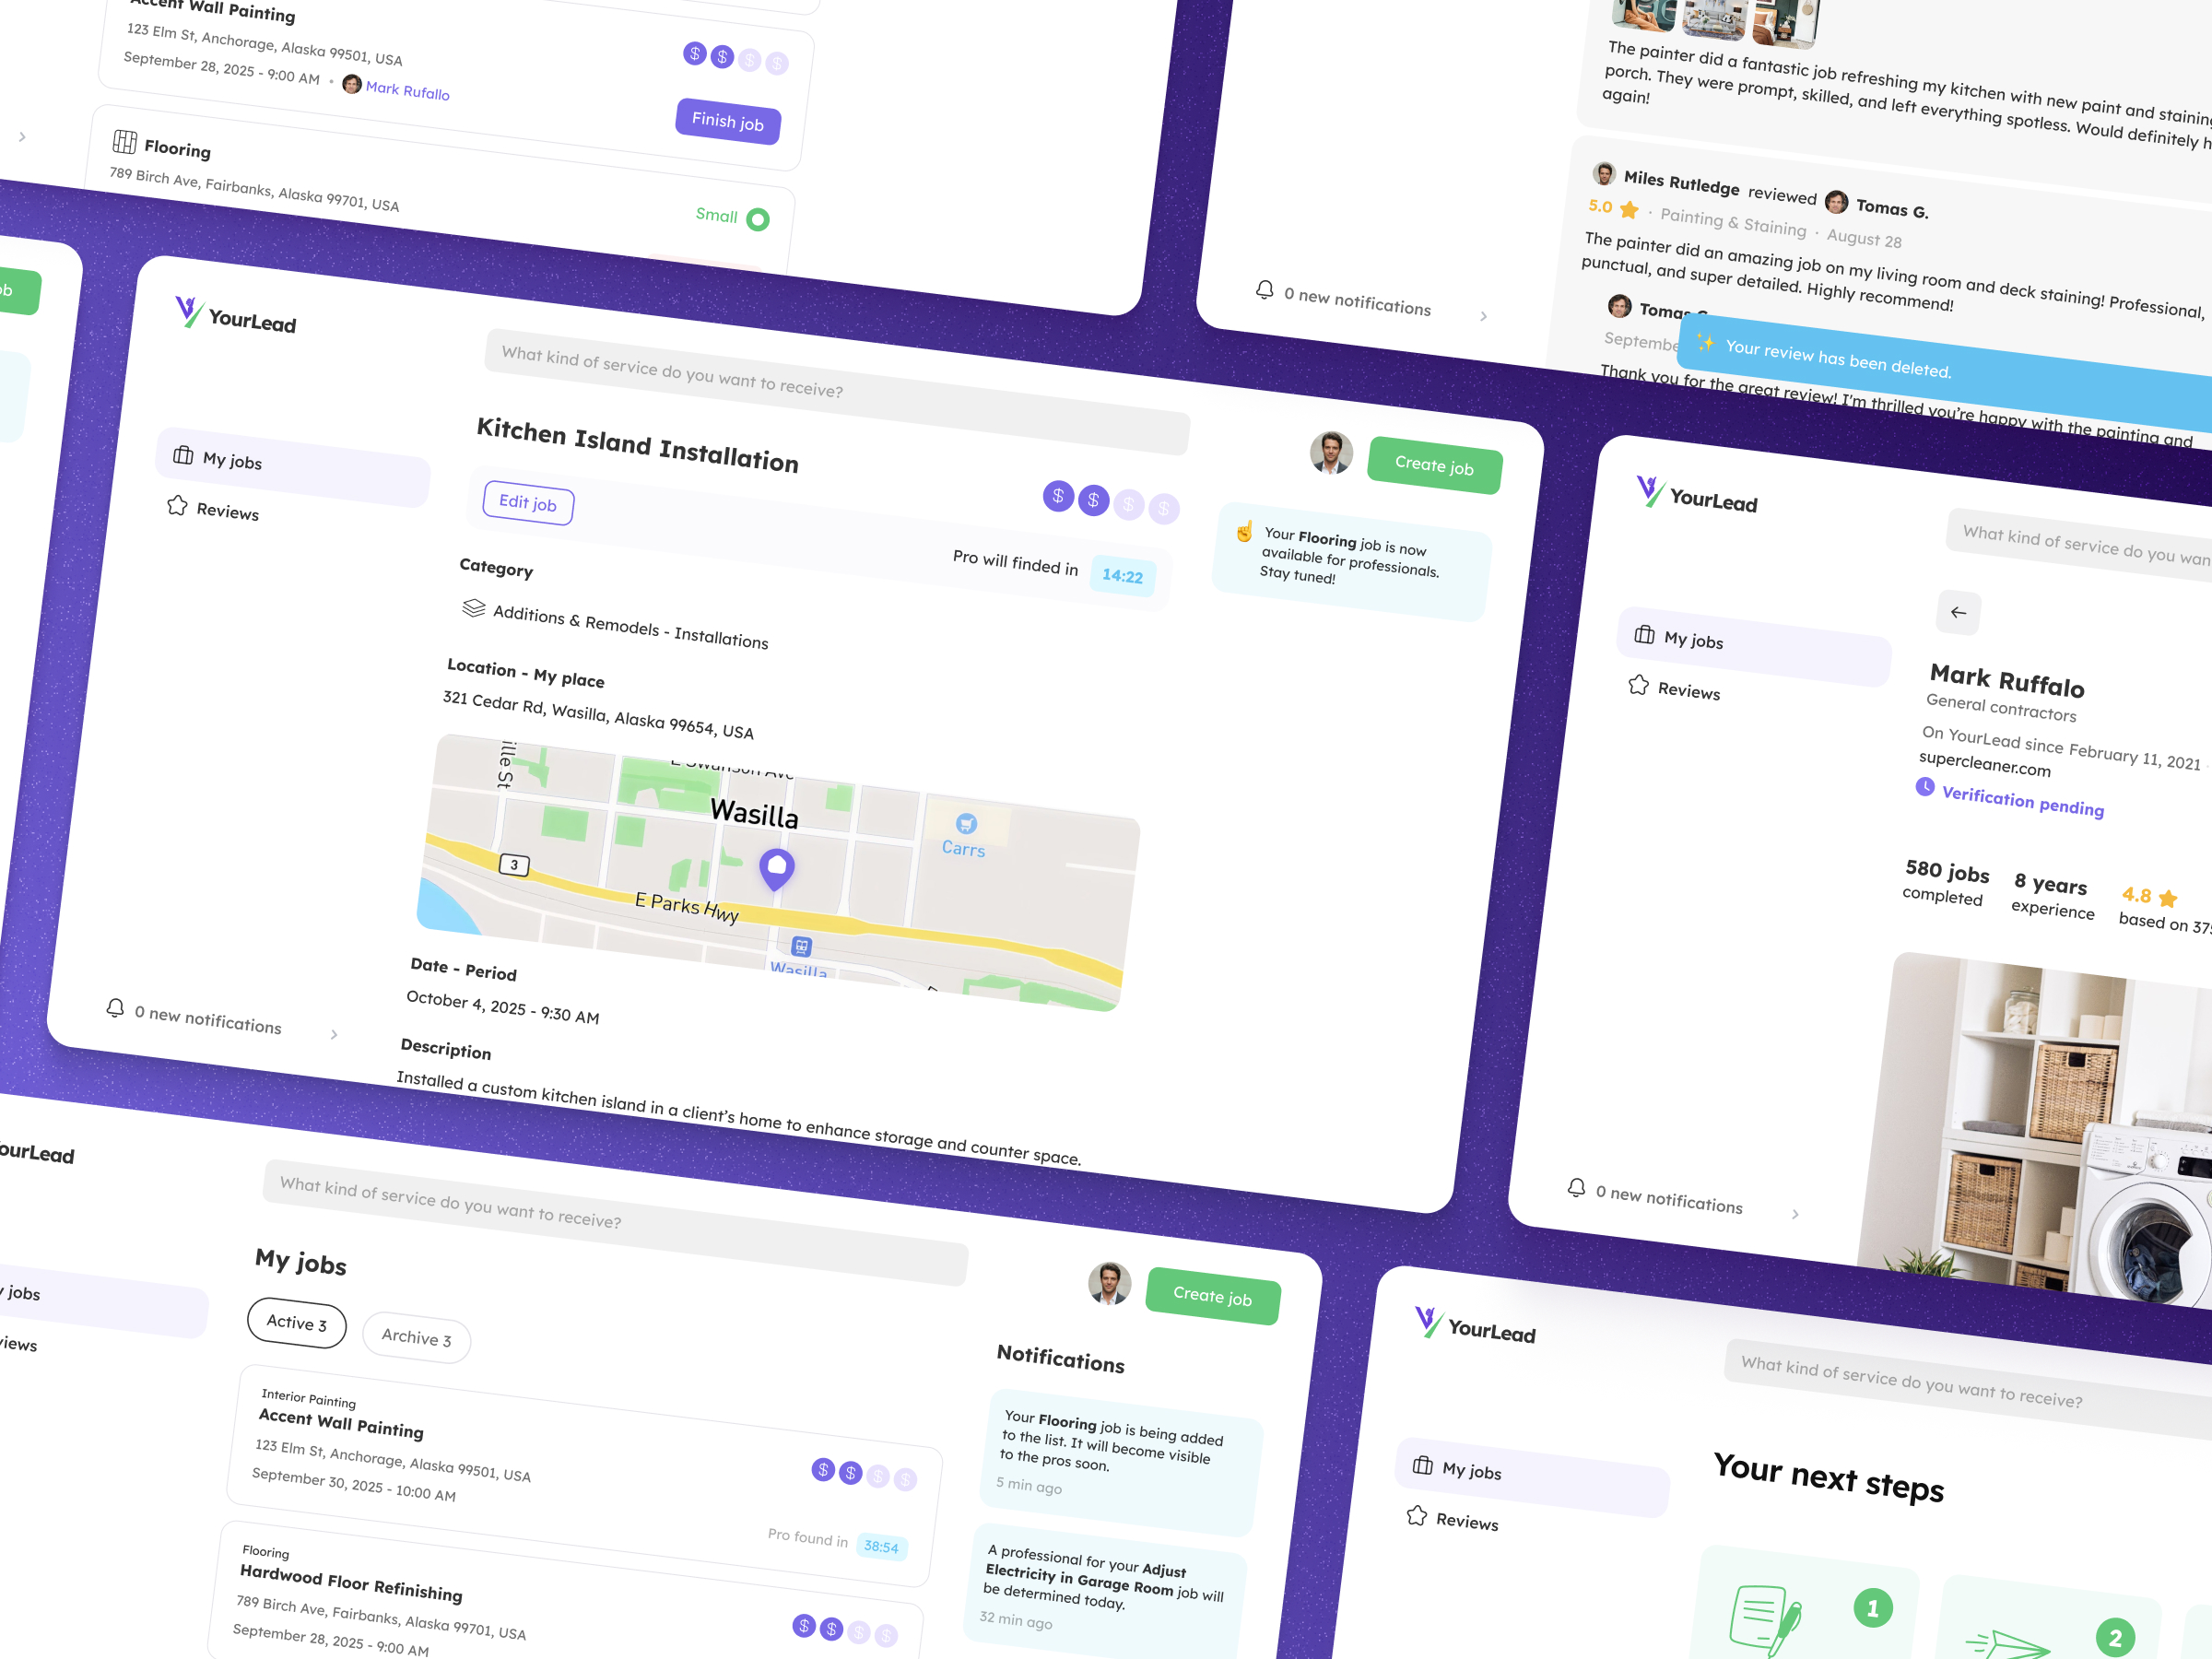
Executing Web Application Performance Tests
Testing involves systematically evaluating how your application functions under conditions that mimic real-world usage. It seeks to answer fundamental questions: What components are sluggish? When does latency occur? And which users are affected?
Begin with a foundational audit. Tools such as Lighthouse, Chrome DevTools, WebPageTest, and browser performance profilers are invaluable here. While they aren’t magical solutions, they provide an initial, clear view of load times, resources blocking rendering, redundant code, image optimization issues, and layout instability.
Next, evaluate actual user journeys. Do not limit your testing to the homepage. During optimization efforts, examine critical paths such as login, search functionality, checkout processes, account registration, dashboard initialization, report generation, settings adjustments, media uploads, and any other frequently repeated actions. A landing page might achieve high scores while the core product experience remains cumbersome.
It is also crucial to test on physical devices, particularly if your user base is predominantly mobile. High-end laptops connected to stable office networks can mask performance issues. Mid-range smartphones, however, will reveal the true state of your application’s efficiency—often with brutal honesty.
For APIs and infrastructure, incorporate load and stress testing. The objective is to understand system behavior during traffic surges, when multiple users access the same endpoint simultaneously, or when background tasks compete for resources. The aim is not to deliberately crash the system, but to identify vulnerabilities before your users encounter them.
Furthermore, testing should occur both before and after implementing changes. If you optimize images, implement code splitting, or introduce caching, remeasure performance. I have observed "improvements" that enhanced one metric while degrading another. While frustrating, this reinforces the importance of continuous verification.
Post-Launch Performance Monitoring
Testing provides static snapshots; monitoring reveals ongoing real-world behavior.
This distinction is critical. Laboratory tests occur in controlled environments. In production, users introduce unpredictability: outdated browsers, unstable networks, diverse device dimensions, extended session durations, unconventional navigation patterns, and unexpected traffic spikes. Identifying these issues early is essential.
A robust monitoring strategy typically includes Real User Monitoring (RUM), synthetic monitoring, server log analysis, distributed tracing, error tracking, uptime verification, and automated alerts. RUM illustrates how actual visitors perceive your application. Synthetic monitoring performs scheduled checks on key workflows. Distributed tracing helps pinpoint where time is consumed across various services.
For infrastructure oversight, tools like Prometheus and Grafana are widely adopted because they enable teams to track server health, latency, error rates, and resource consumption. Shakuro also integrates these tools into its custom web development stack, alongside CI/CD practices and cloud-native infrastructure. Such configurations make performance data visible and actionable, rather than buried in disjointed logs.
Performance monitoring should also accompany every release. New features can subtly increase bundle sizes or slow down specific endpoints. Without active surveillance, teams might only discover these regressions weeks later through customer support tickets—a far from ideal scenario.
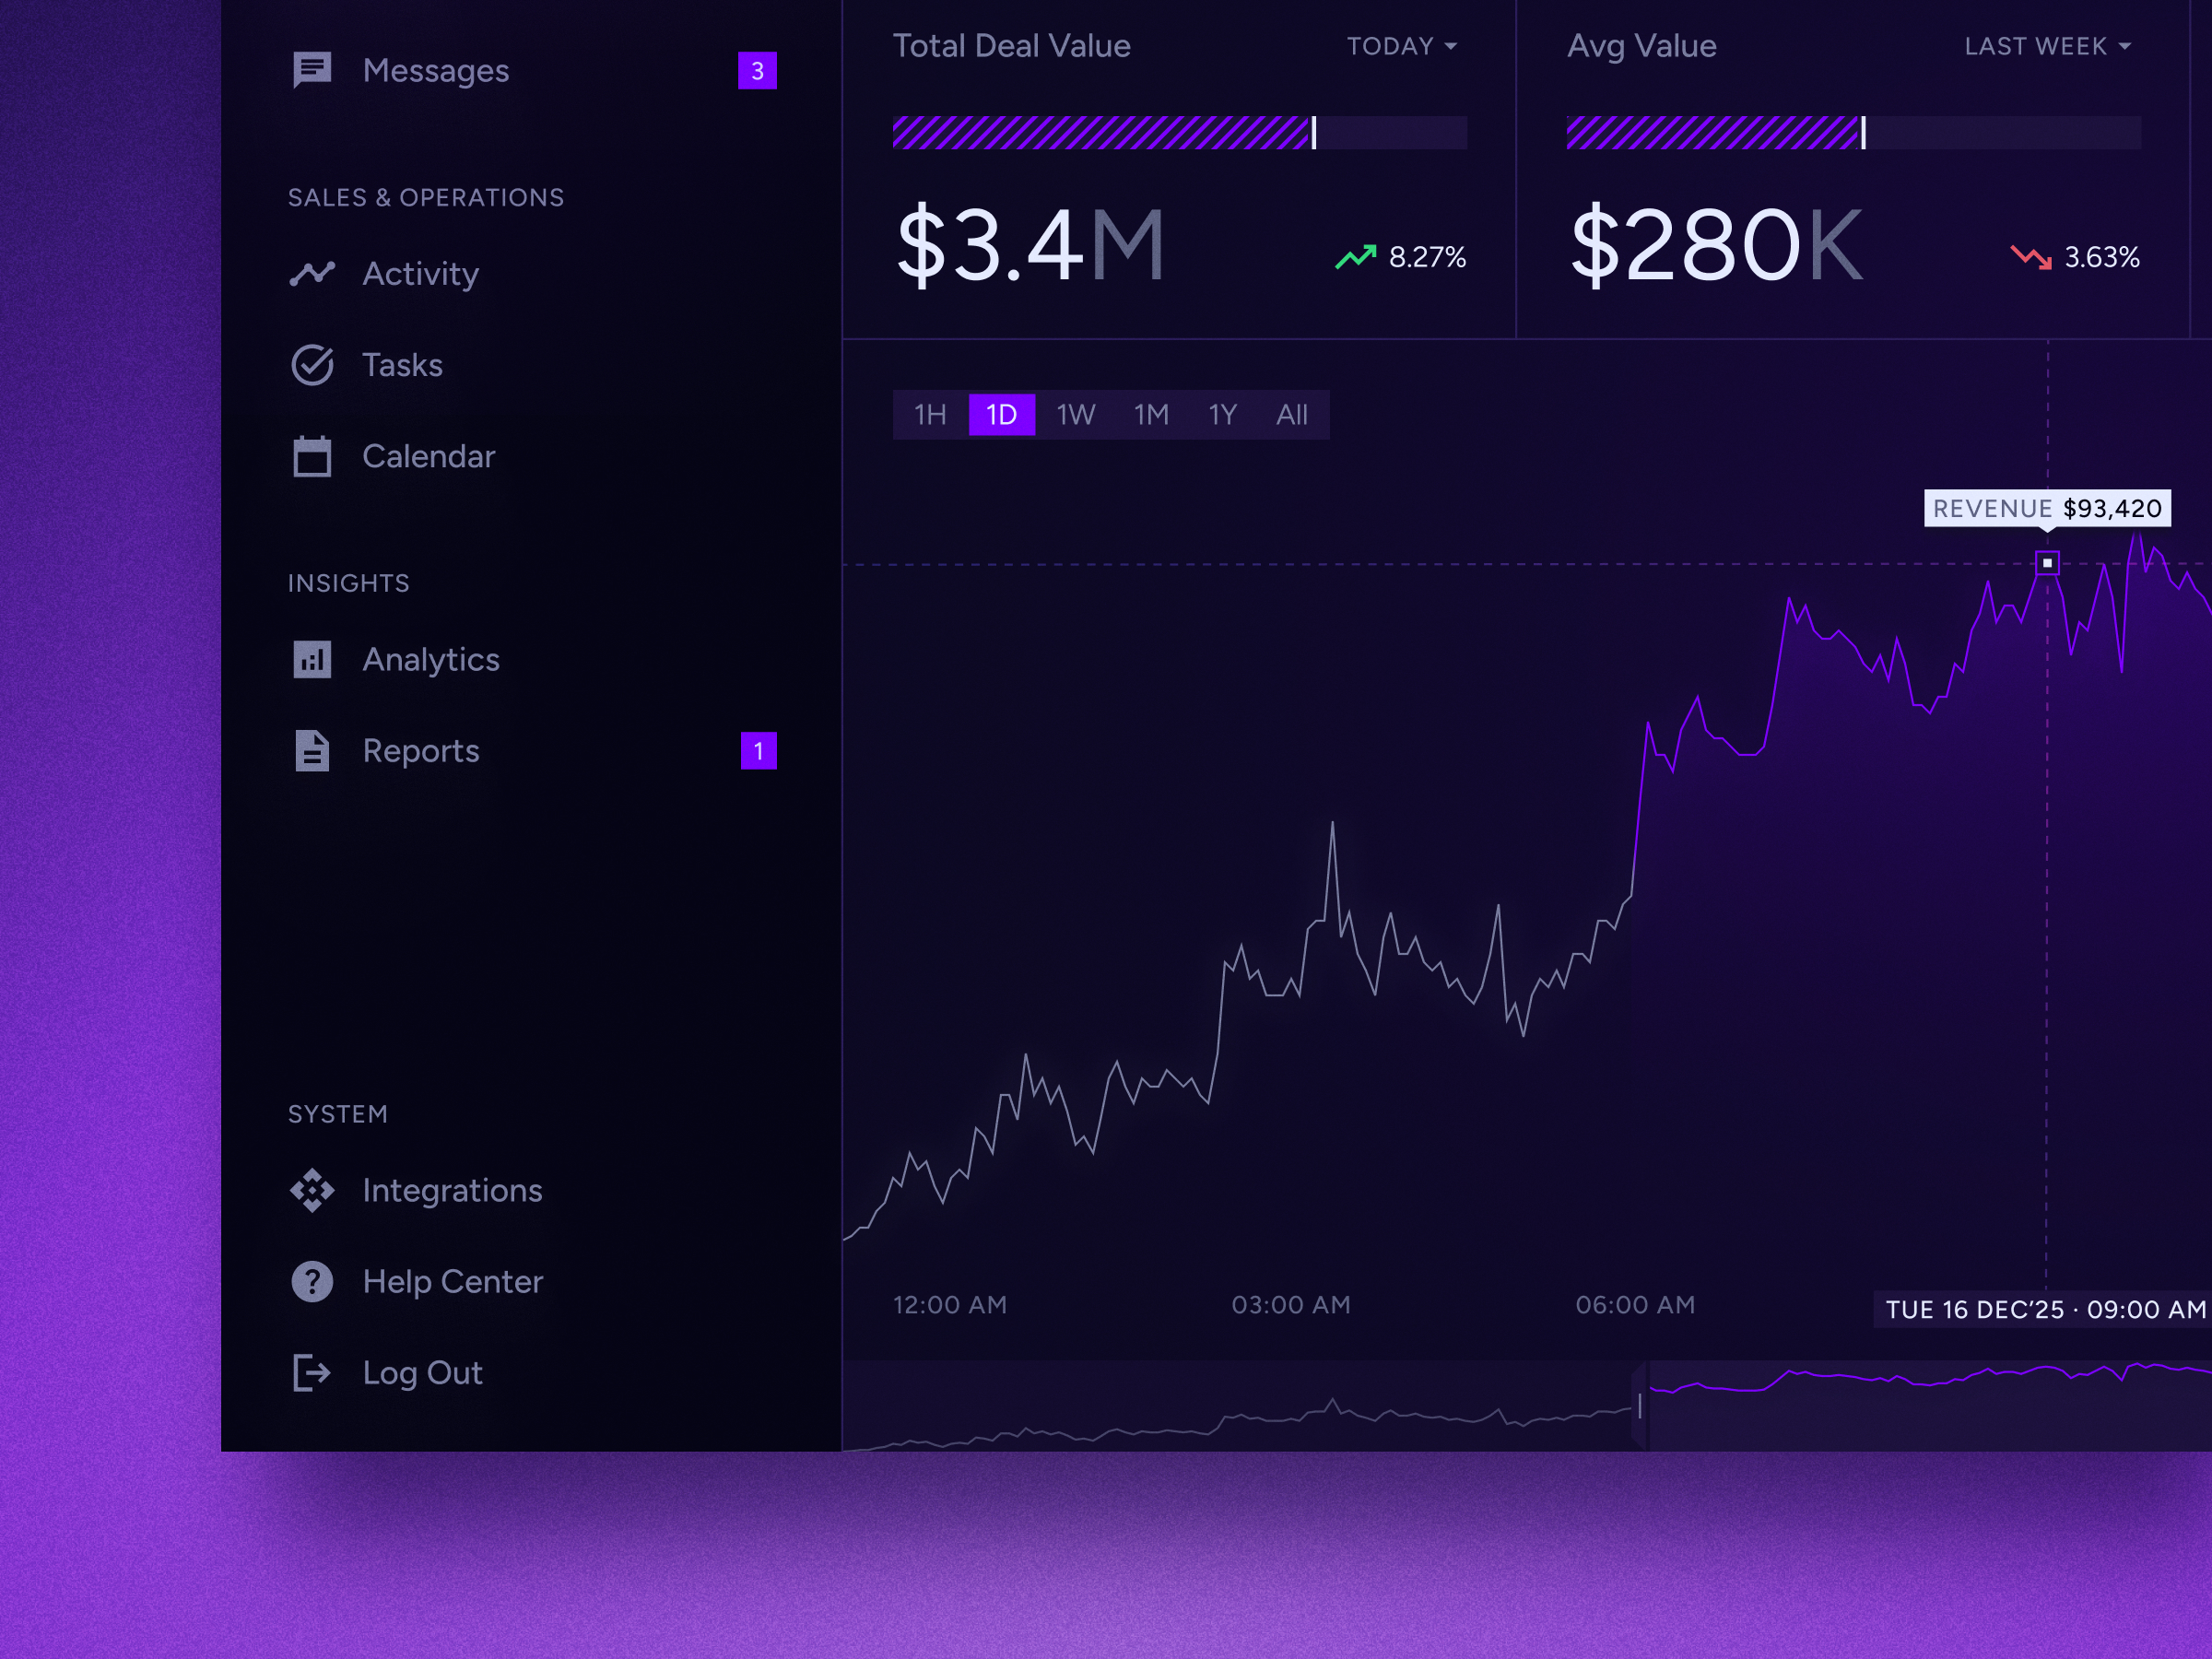
Strategies for Frontend Optimization
Users typically notice improvements in the frontend first, making it a critical area for optimization efforts.
Begin by addressing your code bundle. Implementing code splitting prevents the entire application from being delivered to every user simultaneously. Lazy loading defers the execution of non-essential code, images, or components until they are actually required. This approach is particularly beneficial for complex products featuring dashboards, modals, charts, administrative tools, and settings pages that do not need to be initialized immediately upon load.
Images require dedicated attention. Ensure they are compressed, serve modern formats like WebP or AVIF when supported, utilize responsive sizing, and prevent large desktop-resolution images from loading on mobile devices. While this may seem fundamental, oversized imagery remains a pervasive issue across the web.
Typography can also impact performance. Limit the number of font weights used, preload fonts judiciously, and ensure text remains visible during the loading process to avoid invisible content flashes. Users expect immediate readability, not blank spaces while fonts download.
For applications built with React, rendering efficiency is paramount. Prevent unnecessary re-renders, apply memoization to expensive components where appropriate, and maintain well-scoped state management. However, avoid over-memoizing simply for the sake of it, as this can introduce its own complexity and maintenance burdens.
Your choice of framework can also aid performance. For instance, Next.js facilitates server-side rendering, static site generation, efficient routing, and other delivery patterns designed with speed in mind.
The overarching principle is straightforward: frontend performance should be integrated into the initial architecture rather than treated as an afterthought or cleanup task.
Additionally, exercise caution with third-party scripts during optimization. Analytics trackers, chat widgets, heatmaps, advertisements, A/B testing tools, and social media embeds may appear insignificant individually. Collectively, however, they can place a heavy burden on the browser. I have observed instances where removing just two marketing scripts significantly improved page responsiveness, even though neither the design nor the backend changed. Minor additions accumulate quickly, so vigilance is key.
Optimizing Backend and Infrastructure
Performance bottlenecks often lurk behind a polished user interface, rooted in backend inefficiencies.
Begin by examining API response times. Identify sluggish endpoints, redundant requests, excessively large data payloads, and unnecessary network round trips. Occasionally, the frontend requests data in a manner that overburdens the server; other times, the backend transmits far more information than necessary for display. Both scenarios present opportunities for refinement.
Database efficiency is another frequent source of friction. Issues such as absent indexes, inefficient join operations, N+1 query problems, poorly optimized search functions, and resource-intensive reporting can severely degrade application speed. A query that performs adequately with 5,000 records may become prohibitively slow when scaled to 500,000.
Caching offers significant performance gains but requires strategic implementation. Cache static assets, frequently accessed API responses, computationally expensive results, and predictable content. However, avoid indiscriminate caching. Serving outdated data can lead to confusing user experiences, particularly in sectors like finance, healthcare, e-commerce marketplaces, or administrative dashboards where users rely on real-time accuracy.
Infrastructure components also play a critical role: Content Delivery Networks (CDNs), auto-scaling capabilities, message queues, rate limiting, background job processing, and deployment pipelines. This holistic approach is vital because web application performance relies on the entire system’s harmony, not just isolated fixes.

A Structured Approach to Web App Performance Optimization
A disciplined methodology prevents teams from wasting effort on arbitrary fixes simply because certain issues are immediately apparent.
- Conduct a Comprehensive Audit: Begin by evaluating current metrics and user journeys. Analyze laboratory data, real-world field data, backend statistics, and product analytics. If available, consult with customer support teams, as they often identify user pain points before these issues manifest in dashboard metrics.
- Prioritize Based on Impact: Distinguish between critical and minor issues. A sluggish settings page accessed monthly by a single administrator is not equivalent in urgency to a slow checkout or registration process. While both may require attention, their business impact differs significantly.
- Optimize the Frontend: Focus on reducing bundle size, implementing lazy loading for non-essential assets, optimizing images, refining rendering logic, and removing or deferring scripts that unnecessarily block page loading.
- Enhance Backend Efficiency: Improve API performance, database query efficiency, and caching strategies. This stage requires careful engineering judgment; avoid implementing caches that merely mask underlying data model inefficiencies.
- Re-test and Validate: Execute the same user flows tested initially. Compare pre- and post-optimization results to ensure that improvements in one area have not inadvertently degraded performance elsewhere.
- Implement Monitoring and Alerts: Establish continuous performance monitoring with regression alerts. This ensures the team is immediately notified if a new release negatively impacts speed or stability.
- Iterate Continuously: Treat performance optimization as an ongoing habit rather than a one-time project. While it may seem routine, this consistent practice yields substantial long-term benefits.
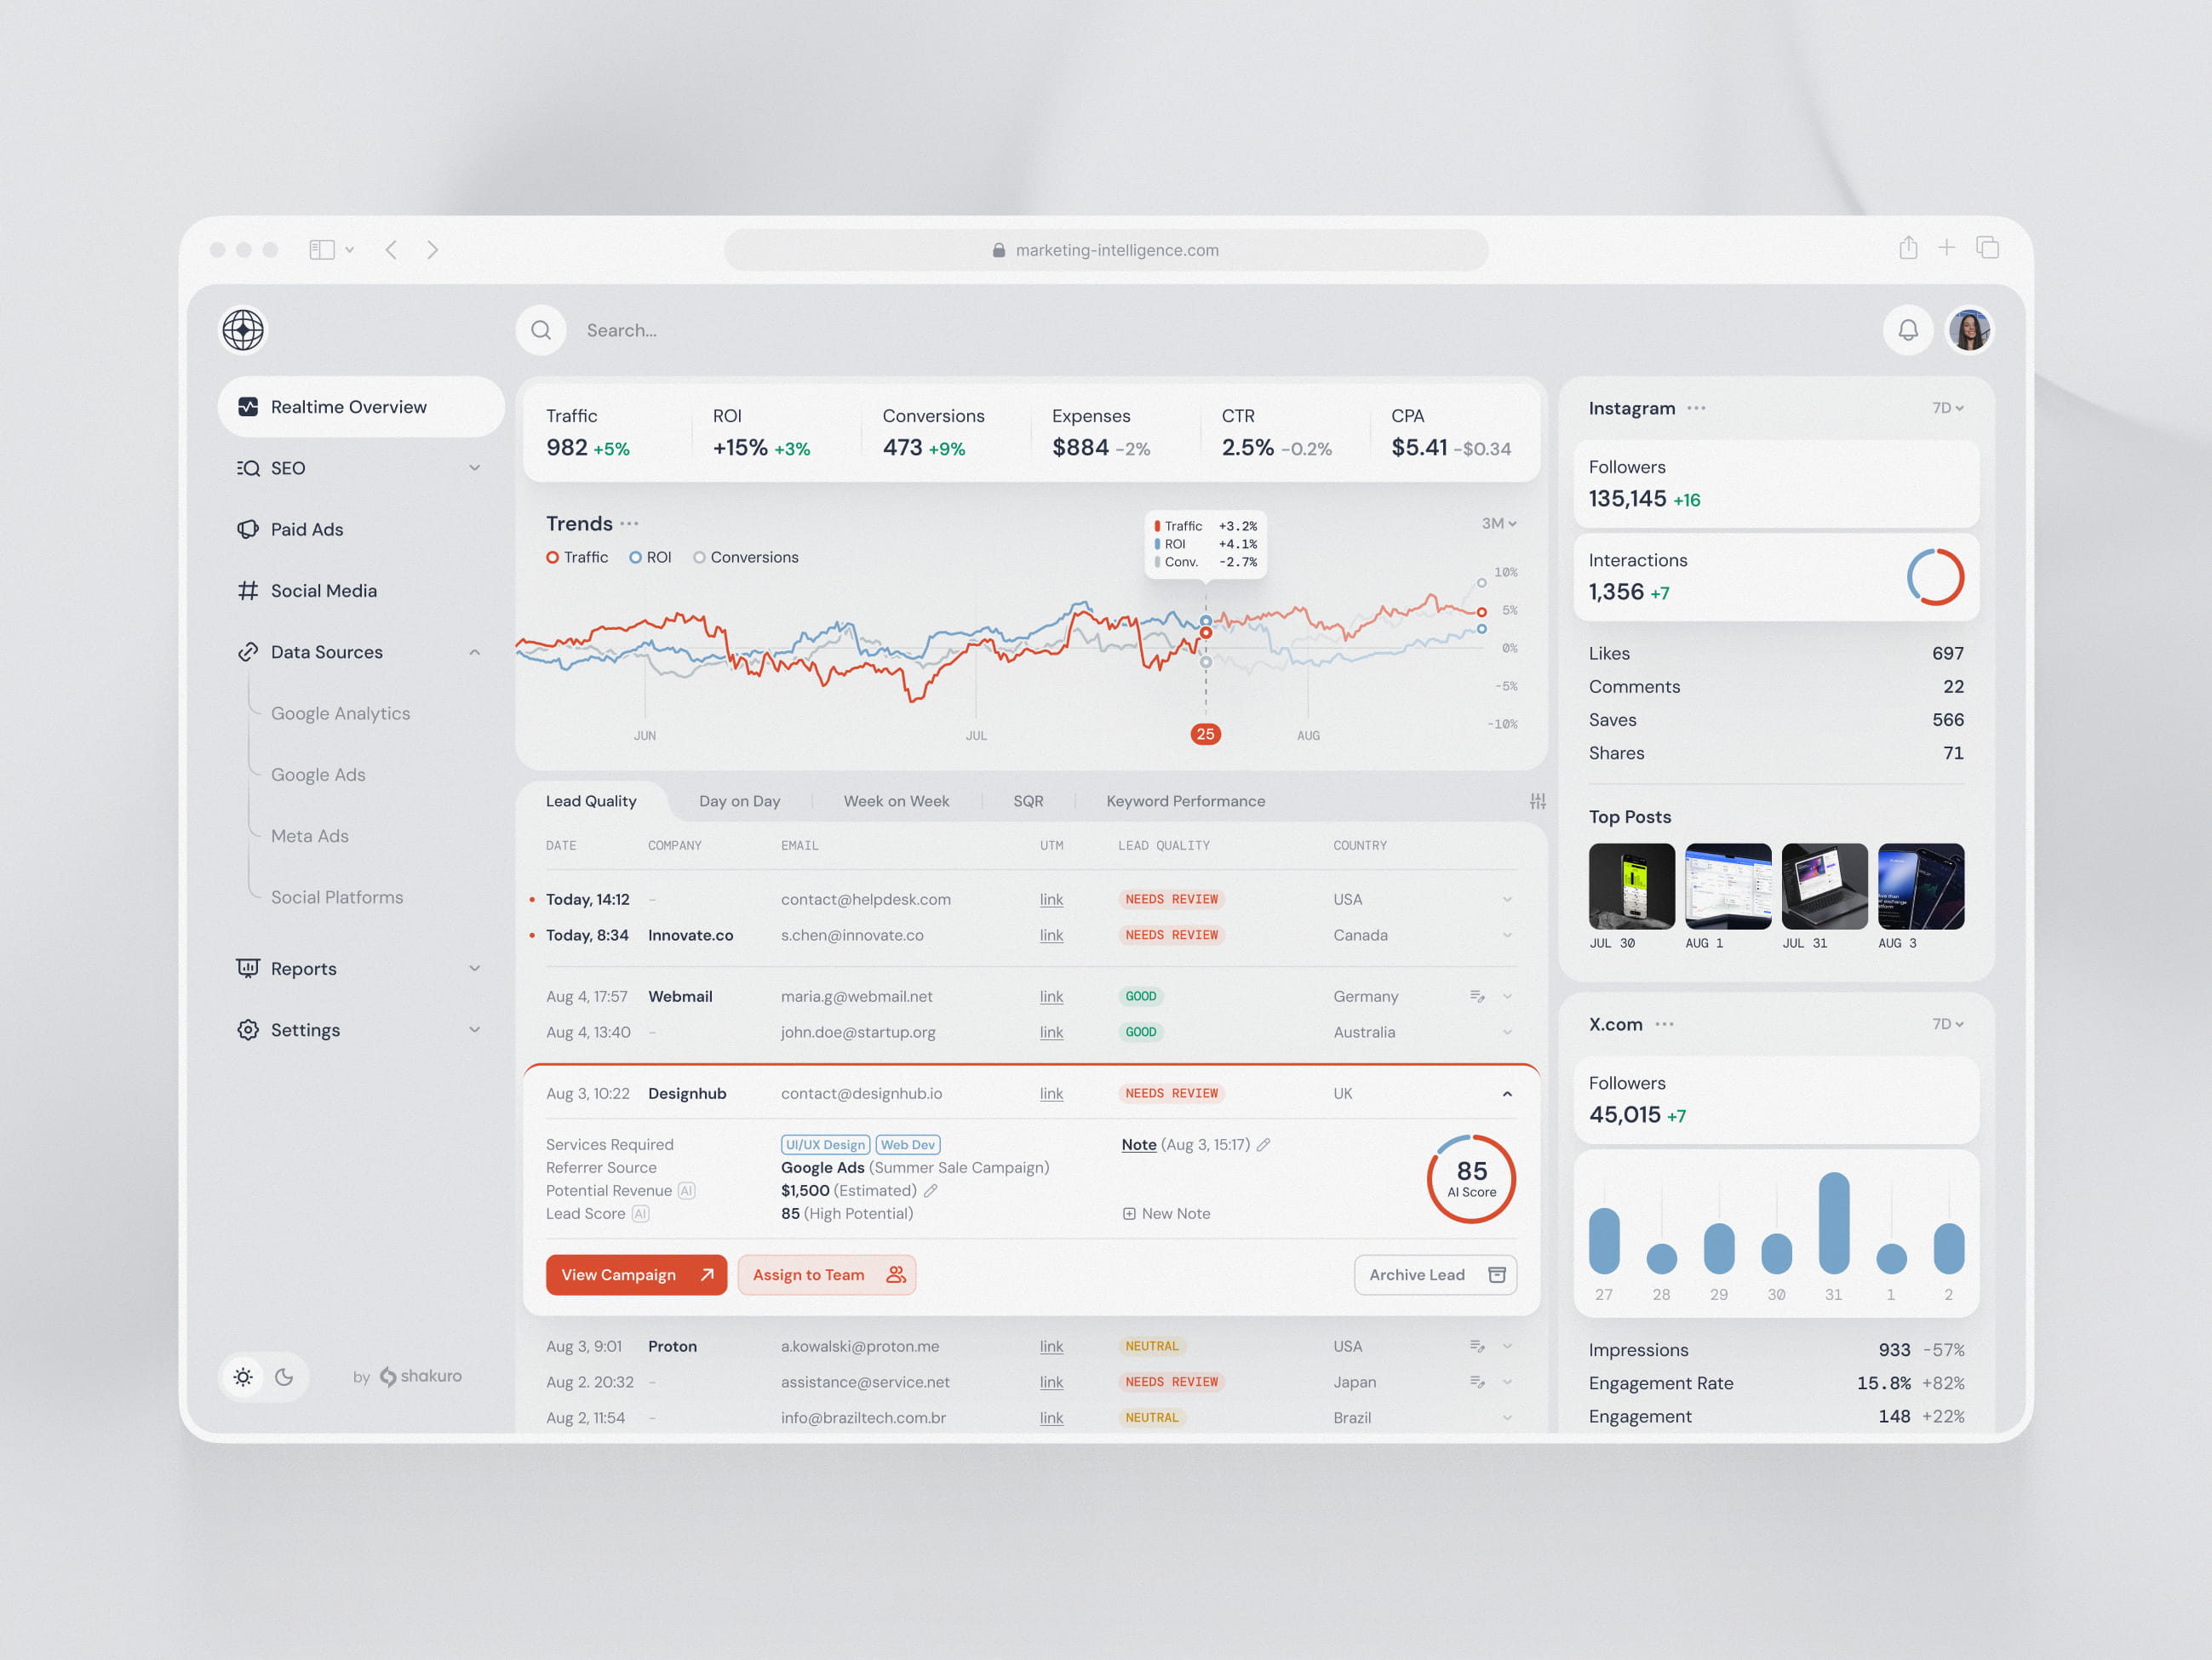
The Value of Partnering with a Web Development Agency for Performance Optimization
Certainly, many performance issues can be resolved internally. Teams should handle straightforward tasks such as image compression, removing redundant scripts, addressing obvious bottlenecks, and verifying database indexes. These are standard maintenance activities.
However, when performance challenges span multiple domains—including architecture, user experience, backend logic, frontend rendering, infrastructure, testing protocols, and monitoring systems—it is often beneficial to engage experts who have encountered similar patterns previously.
A specialized web development firm can evaluate the product holistically. They assess how the interface loads, how APIs respond, how data flows through the system, how releases are validated, and how monitoring detects regressions. This comprehensive perspective is valuable because sluggish applications rarely suffer from a single isolated cause.
We provide end-to-end web development services, covering everything from initial concept and UI/UX design to frontend and backend engineering, testing, deployment, maintenance, and scaling. This level of coverage is frequently necessary for effective performance optimization, not because every project demands a large team, but because performance bottlenecks can exist anywhere within the technology stack.
Concluding Remarks
Superior performance is immediately apparent and impossible to counterfeit.
Users may not be aware of technical metrics like Largest Contentful Paint (LCP) or articulate concerns about API latency. Nevertheless, they instinctively perceive hesitation, layout shifts, unresponsive clicks, frozen dashboards, and excessive device heating. They recognize these issues, even if they lack the terminology to describe them.
The most effective strategy for web app performance optimization is consistent and pragmatic: track relevant metrics, test actual user journeys, monitor production environments, prioritize the most significant bottlenecks, and integrate performance checks into the release workflow. While this process may lack daily glamour, the long-term rewards are substantial.
About the Creator
Shakuro
We are a web and mobile design and development agency. Making websites and apps, creating brand identities, and launching startups.
Enjoyed the story? Support the Creator.
Subscribe for free to receive all their stories in your feed.
Comments
There are no comments for this story
Be the first to respond and start the conversation.