
Email marketing is one of the best alternates of marketing for your products and services. It helps in utilizing the potential of your business and bringing in more revenue. In the B2B industry, there are several email campaigns that run every day. This means so many emails are sent and received every day. Email marketing is a great source of formal and informal communication, as it brings prospects close to the company in a sober manner.
Here, we have compiled and collected data from different resources to seek a detailed insight into the American business sector. We will then compare the impact of email marketing campaigns’ benchmark set by each industry and how well they responded to the audience. Let’s get going!
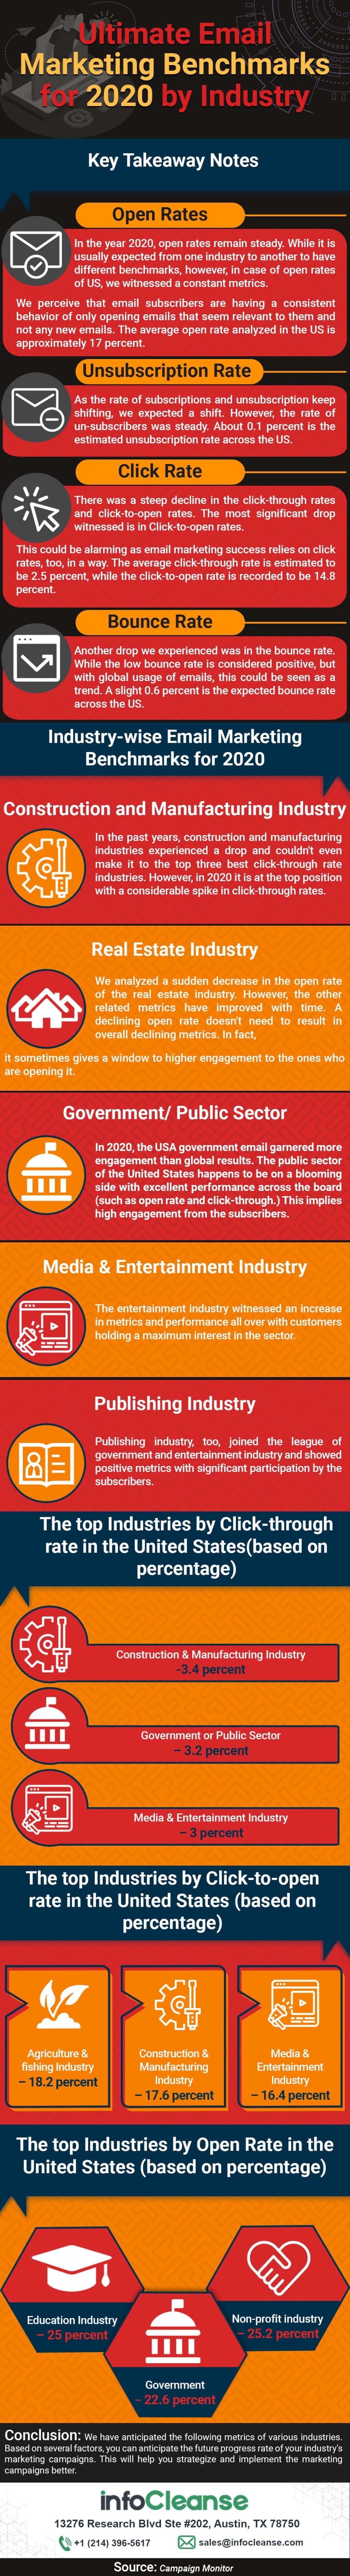
Email marketing benchmarks set by U.S. market for 2020
• Open Rate: The open rates for the U.S. market remained steady throughout the year 2020. At the same time, the market experts were expecting a difference of statistics from one industry to another to display different benchmarks. However, in this case of open rates of the U.S. industries, we could see constant metrics for all. This very well explains that email subscribers or mass audiences are having a similar reaction to email marketing campaigns of every industry. The audience (email recipients) are only opening emails that draw their attention and seem relevant to them. Chances of opening every email were very rare.
Benchmark set by the U.S. industries: The average open rate estimated in the U.S. is about 17 percent.
How to improve the email open rate?
- Work on your subject line
- Optimize your pre-header text
- Check the subject line length, tone, and content
- Check the email timings, day and cadence
• Unsubscription Rate: The unsubscription rate remained as stagnant for all marketing campaigns as the open rate of every industry. Generally, the subscription and unsubscription rate keeps altering; however, there was stagnancy as we saw.
Benchmark set by the U.S. industries: It can be estimated that marketers witnessed about 0.1 percent of the unsubscription rate all across the U.S.
• Click-through Rate: In the case of click-through rate, it was quite the opposite of the other two mentioned above. The click-through rate experienced a sharp decline in the whole U.S. business market. As we may say, even the click-to-open rate saw a significant decline too. This has created some tension in the U.S. market as the response of email marketing campaigns is meager.
Benchmark set by the U.S. industries: An average estimation of the click-through rate is about 2.5 percent. Not to forget, the click-to-open rate is calculated to be nearly 14.8 percent.
How to improve the click-through rate?
- Work on the A/B test
- Improve call-to-action and its design
- Maintain the brand tone
- Create better segmentation
• Bounce Rate: Another sharp decline that we analyzed was in the bounce rate. The rule says the low bounce rate is a reflection of a positive edge; however, it is no more the case. As the maximum population of the world uses emails, we can call it a regular trend too.
Benchmark set by the U.S. industries: A mere 0.6 percent is the estimated bounce rate from all across the United States.
How to improve the email bounce rate?
- Say “NO” to stale email list
- Use confirmation form to opt-in
- Avoid spam content
- Suppress earlier bounces
Now that we know the statistics of the email responses received by the U.S. market as a whole, let’s dig into the industry-wise email marketing benchmarks set for 2020!
Industry-wise email marketing benchmarks set for 2020:
- Real Estate Industry: The real estate industry saw a sudden decline in the open rate overall. Fortunately, the other related metrics of the industry have improved with time. The notion that a decline in open rate will yield a decline in overall metrics is a myth. In fact, sometimes it works in the opposite way. This implies that it gives a scope to better engagement to the ones who are opening it.
- Media & Entertainment Industry: To our surprise, too, the media and entertainment industry has experienced an increase in metrics. It has shown great performance all over, with clients taking maximum interest and engagement in the entertainment sector.
- Construction and Manufacturing Industry: Construction and manufacturing industries are pacing slowly, as we may say in the past few years. There’s a constant drop and has not even made it to the top benchmarks of the U.S. business market. It is not positioned in the top three best click-through rate industries. However, in the year 2020, it seems to be at the top position with gradual growth in the click-through rates.
- Government or Public Sector: The USA government has gotten more response than any industry in 2020. It has been garnered with better engagement with global results. The government sector of the United States seems to be at a flourishing edge in an email marketing campaign. It has shown some excellent performances across the board (for example, open rates, and click-through rates). This also means it has received a higher response rate from the subscribers.
- Publishing or Printing Industry: Publishing industry, too, has shown successful engagement just as the public sector and entertainment and media industry. It has gauged some positive metrics with active involvement by the subscribers.
Top Industries Email Marketing Statistics
The top Industries by Click-through rate in the United States (based on percentage)
• Construction & Manufacturing Industry – 3.4 percent
• Government or Public Sector – 3.2 percent
• Media & Entertainment Industry – 3 percent
The top Industries by Click-to-open rate in the United States (based on percentage)
• Agriculture & fishing Industry – 18.2 percent
• Construction & Manufacturing Industry – 17.6 percent
• Media & Entertainment Industry – 16.4 percent
The top Industries by Open Rate in the United States (based on percentage)
• Education Industry– 25 percent
• Non-profit industry – 25.2 percent
• Government – 22.6 percent
Wrapping Up:
On the basis of these statistics, it is easier for us to anticipate the performance and response of the different industries of the United States. This can act as a great help for marketers to decide their future steps and improvise the marketing campaigns for better response.
About the Creator
Keep reading
More stories from writers in 01 and other communities.
4 Tips to Make a Product Sticky
When we say "sticky", we imagine something that attracts in a way that makes you want to come back again and again. In mobile development, creating a "sticky" product is a cherished desire and a key goal. I've been a product manager for over five years and love finding new angles to improve my projects. I want to tell you about James Clear's technique described in his book Atomic Habits. It can be applied to both existing products and new ones to make them more valuable. Since a sticky product is related to the habit loop, I have chosen four habit-forming criteria to focus on: make the product easy, obvious, satisfying, and rewarding. I suggest to reveal each criterion in the following questions:
By Artem Kalenchukabout 12 hours ago in 01
BARE HUNTER
CHAPTER 15 I pulled up in front of Sandy’s a little early, so I texted Becca again and left a message for Sharon, hoping she had a good day and I’d see her tomorrow. Two cars pulled into Sandy’s driveway. I don’t know why I was surprised to see another man with her. We’d been apart for two years and I certainly didn’t waste any time getting back on the horse.
By Tina D'Angelo3 days ago in Chapters


Comments
There are no comments for this story
Be the first to respond and start the conversation.