
The Battery King’s Quiet Erosion: Why CATL’s 54.8% Revenue Boom Might Not Save It
Record‑breaking shipments, a $5.5 billion buyback, and a 42% profit jump — yet the only number that matters is slipping through the cracks.
On July 24, 2026, CATL released its semi‑annual report. Revenue reached RMB 276.9 billion, up 54.8% year‑on‑year. Net profit attributable to shareholders was RMB 43.28 billion, up 42%.
On the surface, profit growth lagged revenue growth by nearly 13 percentage points. Three non‑operating items had a pre‑tax impact of about RMB 6.8 billion on profits:
Foreign exchange gains/losses: a gain of RMB 2.33 billion in the same period last year turned into a loss of RMB 2.81 billion this year, a swing of RMB 5.14 billion.
Government subsidies: fell from RMB 6.06 billion to RMB 4.59 billion, a reduction of RMB 1.47 billion.
Interest income: decreased by about RMB 1 billion year‑on‑year (due to lower demand‑deposit rates and changes in the monetary‑fund structure).
Excluding these three items, core operating profit grew approximately 56%, slightly ahead of revenue growth. The real pressure on margins lies not on the surface of the income statement, but within the business mix.
I. Divergence Among the Three Engines: Who Is Dragging, Who Is Lifting
Power Batteries: Market Share Has Not Been Diluted
Power‑battery revenue reached RMB 192.1 billion, accounting for 69.4% of total revenue, up 46% year‑on‑year. Global market share stood at 40.2%, up 2.2 percentage points from a year earlier. Domestic passenger‑car installation share reached 46.7%, up 5.6 percentage points, while its share in ternary‑battery installations was 75.2%.
These three data points tell one story: automakers are developing second and third battery suppliers, but so far substitution has only occurred in low‑end and mid‑tier models. For high‑end ternary and long‑range LFP solutions, CATL remains the sole supplier.
Energy Storage: Revenue Share Jumps, but Unit Prices Decline
Energy‑storage revenue reached RMB 53.26 billion, rising from 14.7% of total revenue in full‑year 2025 to 19.2%, up 87.5% year‑on‑year. It ranked first globally in shipments for the fifth consecutive year, with H1 shipments of 58 GWh, up 93%.
However, the average unit price for energy storage fell 3% quarter‑on‑quarter to RMB 0.49/Wh. Gross margin was 23.96%, 3.3 percentage points higher than power batteries, but down 1.5 percentage points from 25.5% in the same period last year. The reason: about 40% of energy‑storage orders delivered in H1 were signed in late 2025, when lithium carbonate was priced at RMB 80,000–100,000/ton; Q2 average lithium prices ran at RMB 170,000/ton. The concentrated delivery of fixed‑price orders directly compressed gross margins.
Recycling: The Only Business with a Year‑on‑Year Margin Increase
Battery materials and recycling revenue reached RMB 18.8 billion, up 67%. Gross margin was 27.04%, up 5.81 percentage points year‑on‑year. Domestic lithium‑battery scrap volume in H1 2026 reached 472,000 tons, up 21.6%. CATL established Times Resources Group, elevating recycling from a supporting business to a strategic pillar. The direct reason: in a lithium‑price upcycle, recycled materials gain a widening cost advantage.
II. The Gross Margin Decline Cannot Be Summed Up as “Rising Costs”
H1 2026 consolidated gross margin: 23.93%, down 1.09 percentage points year‑on‑year.
Q2 gross margin: 23.15%, down 1.67 percentage points from Q1’s 24.82%.
Breaking down the cost structure per Wh:
Lithium carbonate averaged ~RMB 120,000/ton in Q1 and rose to RMB 170,000/ton in Q2. CATL’s long‑term contract pricing cycles range from two weeks to one month, so batteries delivered in Q2 corresponded to procurement costs from late Q1 to early Q2.
Non‑linked materials (copper foil, electrolytes, 6F) also rose in tandem, with a transmission lag of about 2–4 weeks.
Fixed‑price energy‑storage orders accounted for roughly 25% of Q2 shipments. These orders locked in selling prices at the start of the year but did not lock in raw‑material costs.
Taken together, the comprehensive battery price in Q2 was about RMB 0.56/Wh, flat from the second half of last year, and did not follow raw‑material price increases. Management described this on the earnings call as “prioritising volume growth and price stability to expand market share.” In effect, the company sacrificed short‑term margin to capture further share.
III. Cash Flow and Operating Efficiency: The “Lengthening Payment Cycle” Driven by Energy Storage
H1 operating cash flow: RMB 60.2 billion, up only 2.6% year‑on‑year. Revenue grew 54.8%, a gap of 52 percentage points.
The gap came from two main sources.
Accounts receivable turnover days rose from 52 days to 67 days. Energy‑storage project collection cycles extended from 3–6 months to 6–9 months. Inventory balance reached RMB 130.8 billion, up 38.4% from year‑end 2025. Finished‑goods inventory was RMB 47.6 billion, up 110.7% from RMB 22.6 billion at end‑2025.
Management attributed this to building stock in advance for the peak season in the second half. The 94.86% capacity‑utilisation rate supports that explanation: production lines are running at full tilt, indicating proactive stocking rather than passive accumulation. Still, the build‑up consumed operating cash flow, causing cash growth to lag revenue growth sharply.
Contract liabilities reached RMB 36.48 billion, up 29% year‑on‑year. Downstream prepaid orders are growing, but at a slower pace than revenue growth, indicating that automakers are gaining bargaining power on payment terms. That is a natural consequence of widespread losses and tight cash flow among OEMs, which then transmits upstream.
IV. RMB 40 Billion Buyback: A Record, but Manageable as a Percentage of Book Capital
Buyback ceiling: RMB 40 billion; floor: RMB 20 billion; price cap: RMB 573/share. All shares to be cancelled (capital reduction). Based on the July 24 closing price of RMB 383, the cap price is 49.6% higher.
Three comparative metrics:
RMB 40 billion represents 10.7% of monetary funds (RMB 375 billion).
3.5% of total assets (RMB 1.14 trillion).
10.5% of net assets (approximately RMB 380 billion).
The buyback will be funded by green‑innovation bonds issued in H1, totalling RMB 19.5 billion at coupon rates of 1.48%–1.70%. At current wealth‑management yields of 2.5%–3%, the bond‑funded buyback offers an arbitrage spread of about 100–150 basis points. This is not a “burning cash to show resolve” move; it is a financially rational and balance‑sheet‑feasible operation.
Post‑cancellation, total shares will be reduced to approximately 4.598 billion, automatically boosting earnings per share by about 1.5% if net profit remains unchanged. Long‑only institutional investors will thus increase allocations, while trading‑oriented capital will react only modestly.
V. Ranking the Risks: Short‑Term Reversible vs. Medium‑Term Structural
Short‑term reversible (observable in Q3–Q4)
FX losses. The RMB appreciated ~2.8% against the USD in Q2. With overseas revenue accounting for 31.5% of total, CATL’s FX exposure is material. If the exchange rate stabilises or weakens in Q3, these losses could reverse.
High inventory. The stockpiling thesis hinges on Q3 shipment acceleration. Management guided that “demand growth in the second half is determined.” The verification point will be production‑scheduling data for September–October.
Medium‑term structural (require ongoing monitoring)
Declining R&D intensity. R&D spending was RMB 11.38 billion, up 12.7% year‑on‑year, but as a percentage of revenue it fell from 5.64% to 4.11%. The industry is transitioning from liquid lithium‑ion batteries to semi‑solid/solid‑state; Toyota, LG, and Samsung SDI are accelerating their solid‑state patent filings. If CATL continues to reduce R&D intensity, the window for narrowing the technology gap will shorten.
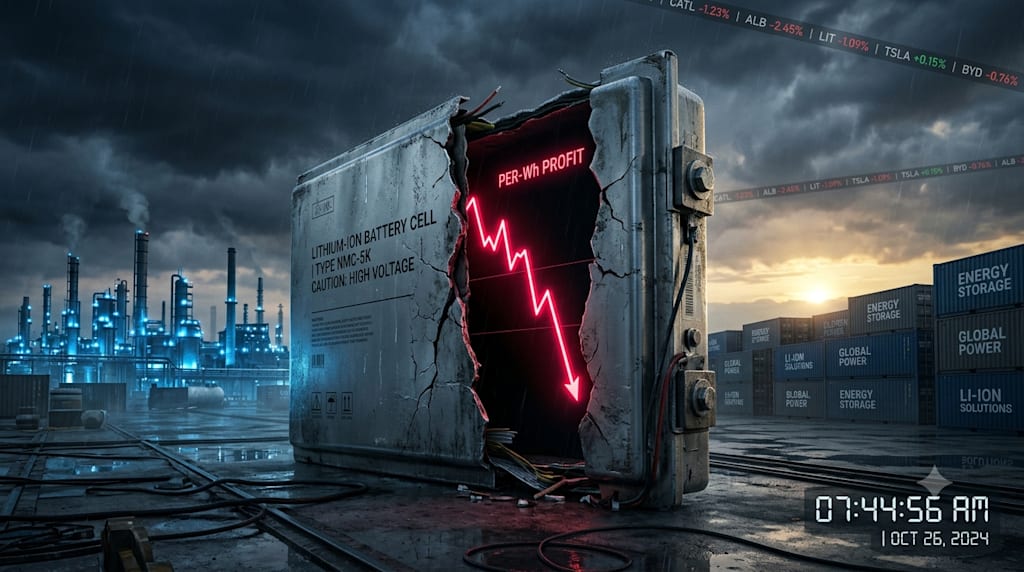
Continuing decline in per‑Wh net profit. Full‑year 2025 was approximately RMB 0.12/Wh; H1 2026 was about RMB 0.097/Wh, a 19% drop. Per‑Wh net profit is the core metric for measuring CATL’s pricing power and cost‑pass‑through ability. If lithium carbonate falls back below RMB 120,000/ton in H2 and new high‑priced energy‑storage orders begin delivery, this metric could recover to above RMB 0.11/Wh. Otherwise, full‑year profit growth will definitively lag revenue growth.
VI. Conclusion: A Specific, Verifiable Judgement
This earnings report does not support the narrative that “CATL is back to high‑growth,” nor does it support the narrative that “the leader has peaked.”
It shows a clear structure:
Energy storage boosts revenue growth but lengthens cash‑collection cycles and compresses short‑term margins.
Power batteries hold their share but have not raised prices; per‑Wh margins are being eaten by raw‑material costs.
The buyback is financially sensible but does not change the medium‑term pressure on the core business.
The metric to watch in the second half is whether Q3 per‑Wh net profit can recover from 0.097 to above 0.11 RMB. Whether the buyback is completed or the share price rebounds are secondary. If the per‑Wh figure recovers, the market will reprice CATL’s cyclical recovery capacity. If it cannot, profit growth trailing revenue will become a confirmed trend for the full year.
This judgement can be falsified by the second‑half earnings reports. Anything beyond that is superfluous.
About the Creator
Jin
Writer of reamstories
https://reamstories.com/jin
Enjoyed the story? Support the Creator.
Subscribe for free to receive all their stories in your feed. You could also become a paid subscriber, letting them know you appreciate their work.
Comments
There are no comments for this story
Be the first to respond and start the conversation.