


Many businesses aim to deliver their goods and services quickly and efficiently to their clients. With the help of insights from big data, companies can achieve this goal. However, despite this, many firms still have difficulties in obtaining and examining their data, making data management a significant challenge.
In this article, we'll cover using Power BI as a platform for data analysis, forecasting, and reporting without the use of coding. Apart from that, you also need to pay attention to how to build a BI Software dashboard.
Read to the end so that your company can perform optimally in making decisions.
What is Power BI?
Microsoft Power BI Desktop is a reporting and data modeling tool that uses an in-memory database to connect data quickly and intuitively, manipulate and transform it, create relationships, and then visualize the results.
Reports created and data sets are essentially publishable to Power BI Services where security and functionality combine to provide a seamless experience for consumer reports. AI filtering, search, analysis, and more can be achieved easily and seamlessly.
How Does It Work of Power BI
Power BI can be used in a variety of ways, depending on the specific needs of the organization. Here are a few common ways that organizations use Power BI:
- Connecting to Data Sources: Allows users to connect to a variety of data sources such as databases, Excel spreadsheets, and cloud services like Azure and Google Analytics.
- Creating Reports and Dashboards: Once the data is connected, users can create reports and dashboards that visualize the data in a meaningful way. Offers a wide range of visualizations, including charts and tables to help users understand and interpret their data.
- Data Transformations: easy-to-use data transformation feature that allows the users to clean, shape, and transform the data before visualizing it.
- Data Modeling: allows users to create data models, which are used to combine multiple data sources into a single view. This enables users to create more advanced reports and dashboards.
- Sharing and Collaboration: reports and dashboards can be easily shared with others in the organization, enabling collaboration and data-driven decision-making.
- Natural Language Query: Power BI enables users to ask questions in natural language, and the tool will generate visualizations accordingly.
- Real-time data streaming: Power BI can handle real-time data, which enables users to monitor the business in real-time, and take action quickly.
- Mobile-optimized report viewing: Power BI provides mobile-optimized reports that can be accessed from any device, including smartphones and tablets.
Scalability of Power BI
Power BI has been widely used by the industry, but this time there are some things you need to know about the actual uses that are the key to your success in scaling up your business. Here are the 6 best Power BI sophistications you need to know:
Easily Integration with Multiple Data Sources
This business intelligence software can integrate data from various sources from various types of data. This allows you to create common data models and aggregate data from various sources such as databases, online services, and disparate files.
In addition, you can add new sources using the built-in Power Query editor in Power BI. It is used to modify or edit data files before they are loaded into Power BI. The Power Query Editor acts as an intermediate data container where you can modify data by selecting rows and columns, splitting rows and columns, rotating and dropping columns, etc.
Visualization forecasting and data mining
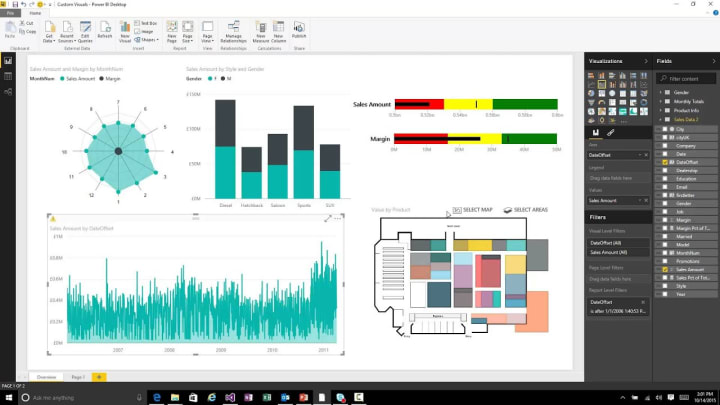
One of the interesting features of Power BI is that it can create data visualizations and make predictions about the performance that has been done. This will have a very good impact on business, especially in finding the right information from data.
As well as data on sales. You can visualize the data so that you can see the increase in sales and the margin earned from each of your sales.
Helping to report the projects
One of the key benefits of using Power BI for project reporting is its ability to automate the process of data collection and analysis. With Power BI, users can schedule data refreshes and alerts, so they are always up-to-date on the status of their projects. Additionally, Power BI also allows for collaboration among team members, allowing them to easily share data and insights.
Overall, Power BI provides an efficient and user-friendly way to report on projects, helping teams to make data-driven decisions and stay on top of the progress and performance of their projects.
Without Coding Anymore
The convenience that you will get is that you don't need to need coding to create data visualizations or input data into Power BI. This is very suitable for companies that do not have expert developers. It is enough for you to input your data then your data can be visualized quickly.
Handle Sets of data
Imagine if you have thousands or even millions of data that you need to manage. These tools help you to process thousands and even billions of data that you have so that it can cut your processing time, and can be used to develop your business in the future.
Take Decision Quickly
This convenience is the most sought after by all business people. Making decisions is not easy, but with the help of this Business intelligence software, you can take easy and fast steps in making decisions. You no longer need to think about how to process this much data, or how to interpret a lot of data, just by using these Power BI tools, you can easily take further action in business.
Business Intelligence Software Statistics, including Revenue, Average Spend, and General Forecasts
The Business Intelligence software market has found its own leader. Industrial giants such as IBM, Microsoft, and Oracle. However, a new software business is being started aiming for its share.
The statistics will dispel any doubts you have because they confirm that the Business Intelligence business model is really profitable and growing fast:
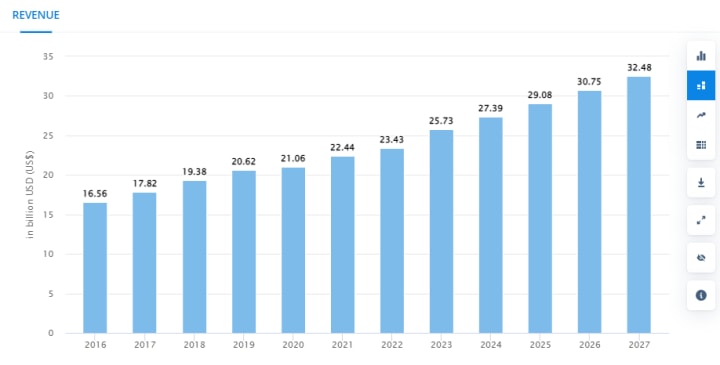
- Revenue in the Business Intelligence Software segment is projected to reach US$25.73bn in 2023.
- Revenue is expected to show an annual growth rate (CAGR 2023-2027) of 6.00%, resulting in a market volume of US$32.48bn by 2027.
- The average Spend per Employee in the Business Intelligence Software segment is projected to reach US$7.39 in 2023.
- The global market share of IBM was 0.0% in 2020.
- In global comparison, most revenue will be generated in the United States (US$12,690.00m in 2023).
Therefore, several in-depth studies indicate rapid growth of the Business Intelligence Software market in the next 4 to 9 years.
Build Dashboard BI Software
Building a dashboard for business intelligence (BI) software involves several steps. Here is a general overview of the process:
- Gather requirements: Understand the specific needs of your users and what data they need to see in the dashboard.
- Connect to data sources: Connect to the various data sources that will be used to populate the dashboard. This may include databases, spreadsheets, and APIs.
- Prepare and clean data: Prepare and clean the data so that it can be easily used to create visualizations and reports.
- Design the dashboard: Design the layout and look of the dashboard, including the types of visualizations and charts that will be used.
- Build the dashboard: Use a BI tool or programming language to build the dashboard and connect it to the data sources.
- Test and deploy: Test the dashboard to ensure it is functioning correctly, and then deploy it for use by the end-users.
- Monitor and maintain: Monitor the dashboard to ensure it continues to function correctly and make updates as needed.
It's also important to note that the above-mentioned steps are not always linear, You may need to iterate through some steps multiple times before achieving the desired outcome.
Conclusion
Business Intelligence software tools are great tools to help you in gathering data, to create decisions for actionable results. Apart from that, if you are interested in making and marketing it again, this will be a promising business opportunity for you
Evidenced by data from Statista which states that Revenue is expected to show an annual growth rate (CAGR 2023-2027) of 6.00%, resulting in a market volume of US$32.48bn by 2027.
So if you want to increase effectiveness or even resell it this is the right software tool for you.
Now that you have all the information to create business intelligence software, it's time to jump into the development process. Contact us for all the details about your future BI software.
About the Creator
Emveep
We develop Web & Apps to help small and startup business to reach their desired market. Need consultation? say hi at emveep.com
Know about the Access security risks in 2024.
Access security and control systems have become an integral component of organizational security strategies. They protect physical assets and safeguard sensitive information against unauthorized access. These systems determine who can enter or access certain areas within a physical or digital space. As technology advances, the complexity and sophistication of access control systems increase, offering enhanced security features. However, these advancements also introduce new vulnerabilities and potential risks.
By Kevin Tucker4 days ago in 01
UCHHAITH BHAGWATI AND AHILYA STHAN IN MITHILA
Like each area of India, Mithila additionally is loaded with Devi sanctuaries. I saw a considerable lot of them at Darbhanga, be that as it may, the vast majority of them are new. Old Devi sanctuary of Mithila incorporate Uchhaith Bhagwati Sanctuary and Ahilya Sthan, the two of which are referenced in our Indian Sacred writings.
By prashant soni3 days ago in 01


Comments
There are no comments for this story
Be the first to respond and start the conversation.