
Microsoft BI - Bring your data to life with Microsoft Power BI
Applied Microsoft Power Bi: Bring Your Data to Life!
The concept of business intelligence has been around in various forms for more than a century and a half. BI is about understanding the facts - and the relationships between facts - in a way that guides decisions and actions.
As BI continues to evolve, Microsoft is leading the way by bringing a new generation of BI to organizations, with solutions that will extend and build on, rather than replace, existing platforms and tools.
This document introduces the capabilities of Microsoft Power BI Implementation, Microsoft's business analytics service for connecting, visualizing, exploring, and deriving insights from data.
Power BI enables users at every level of data analysis.
IT professionals can:
- Focus on what they love – Data, and provide quality and authoritative data sets to end users, business analysts, and data scientists
- Meet the growing business need for consumable data
- Spend less time on infrastructure maintenance or report development
- Focus on increasing demand for real-time and streaming data sources
- Implement data governance and data-level security for cloud and on-premise data sources
BI analysts can:
- Connect to authoritative data with ease and confidence
- Visually explore data
- Navigate through data quickly, optimized for performance
- Pull data together from different sources, create data models and impactful, interactive reports
- Easily share data models and reports with end-users
End users can:
- get started and see results quickly
- monitor in real-time what matters most, in one place
- explore and use certified data sets to find immediate answers
- Share reports and dashboards with others
- stay connected from anywhere
Learn everything you need to know about implementing Microsoft Power BI.
The concept of business intelligence has been around in various forms for more than a century and a half. BI is about understanding the facts - and the relationships between facts - in a way that guides decisions and actions.
As BI continues to evolve, Microsoft is leading the way by bringing a new generation of BI to organizations, with solutions that will extend and build on, rather than replace, existing platforms and tools.
This document introduces the capabilities of Power BI, Microsoft's business analytics service for connecting, visualizing, exploring and deriving insights from data.
Power BI enables users at every level of data analysis.
With Power BI, Microsoft is expanding the reach of analytics to more users than ever before.
Microsoft Power BI overview
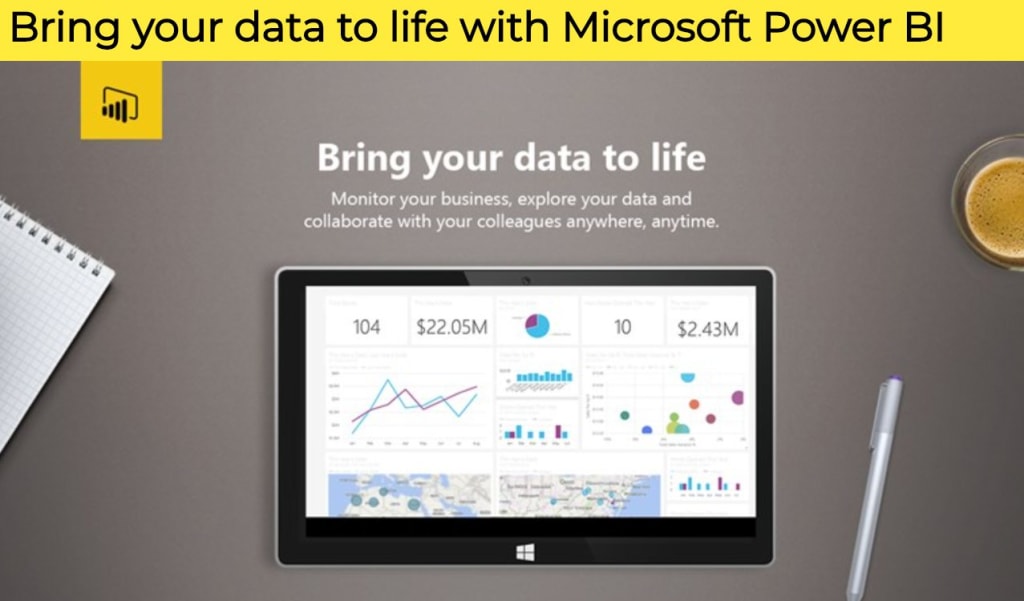
Power BI may be a SaaS offering that permits anyone and everybody to simply hook up with any of their data, create live dashboards and reports, and explore data through interactive visualizations at any time. with Power BI, you'll make all of your data viewable during a single location, no matter where the info resides, enabling a consolidated view of business operations.
Power BI includes two companion applications. The first is Power BI Desktop, a visible data exploration, and reporting tool. The second may be a set of native, interactive mobile applications for Windows, iOS, and
Android devices, providing secure access to measure Power BI dashboards and reports from any device.
In addition, Power BI is often extended with a group of REST APIs which enable developers to integrate
client and web solutions with Power BI or to create custom visualizations.
Advanced analytics in Power BI
Predictive analytics with Azure
Imagine if you'll review the newest output of your organization's fraud model on-demand, or analyze the sentiment of social media users who tweet or post about your products. Power BI brings the predictive power of advanced analytics to allow users to create predictively
models from their data, enabling organizations to form data-based decisions across all aspects of their business.
Quick Insights feature
The Quick Insights feature in Power BI is made on a growing set of advanced analytical algorithms, developed in conjunction with Microsoft Research, which allows users to seek out insights in their data in new and intuitive ways. With an easy click, Quick Insights in Power BI searches different subsets of your data set while applying a group of sophisticated algorithms to get potentially interesting insights. PowerBI scans as much of a data set as possible in an allotted amount of time.
Segmentation and cohort analysis
Segmentation and cohort analysis may be a simple, yet powerful, thanks to explore data and identify deviations from the norm. Segmentation and cohort analysis is just the act of breaking down or combing data into meaningful groups then comparing those groups to spot meaningful relationships in your data. It is typically used to develop a hypothesis about your data and identify areas for further analysis. Power BI has several tools to assist this process, including clustering, grouping, and binning.
- Data streaming in Power BI
- Real-time dashboards
- Setup of real-time streaming data sets
- Visualizations in Power BI
Data visualizations allow you to interact together with your data to seek out business insights. Power BI allows you to choose between an inventory of obtainable visualizations, add a custom visualization that you simply create yourself, or select from our expanding list of obtainable visualizations in the community gallery.
Conclusion
Power BI business analytics tools enable users in the least levels of a corporation to research data and share insights. Through dashboards, Power BI provides a 360-degree view of your most important metrics—in one place, updated in real-time, and available on all of your devices. With one click, explore data using intuitive tools to quickly find answers and
uncover new insights. Power BI allows you to dig deep into your data while being productive and artistic with what
you build. With quite 20 built-in visuals and a gallery of vibrant custom visualizations, Power BI makes it easy-to-use advanced analytics to effectively communicate your message and address business challenges.
About the Creator
Keep reading
More stories from writers in 01 and other communities.


Comments
There are no comments for this story
Be the first to respond and start the conversation.