
How to decode candlestick patterns: Master class
candlestick patterns

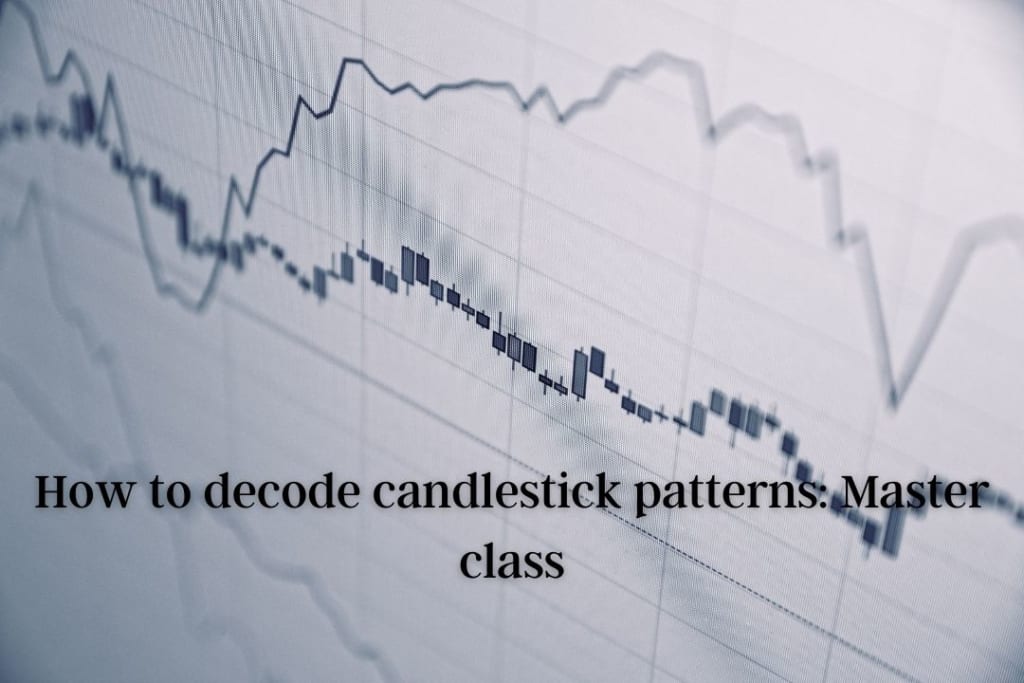
What are Candlestick Patterns?
Candlesticks are the patterns formed on charts that describe the movement in prices of security traded. These are represented graphically on the candlestick chart and help traders predict the market fluctuations. It is primarily a technical analysis tool that is available with online brokers.
Online brokers like PrimeFin provide trading platforms that have the facility of trading tools, analysis, research reports, historical data, various charts and patterns, indicators, etc. All these are helpful for financial market prediction and, accordingly, make an entry and exit.
The candlesticks charts were first developed in Japan and since then have been used by traders for analysing the market. These visually show the price movements with different colours. The regular occurring patterns give an idea of the trade and forecast for short term trading and long term trading.
How to Decode Candlestick Patterns?
The first step of decoding a candlestick pattern is by understanding the components. It has candles that make the charts visible graphically, including the body, upper shadow, and low shadow. The three components make the whole candlestick that aid traders read market changes.
The body is representative of the price range from the opening and closing of the day's trade. If the body is black, that means that the close of the asset was lower than its opening price. On the other hand, if it's white or empty, that is the situation of the close price being higher than the opening price.
However, the traders have the option of customisation in their trading platform. So, if required, they can change the colours. Black could be changed to red and white into the green.
The candle shows the time period, and the data corresponds to that time frame. It has four points for the data:
- Open
- High
- Low
- Close
The open is the first trade during the specified time frame, high is the highest traded price of the asset, low is the lowest traded price of the asset, and close is the last trade of the time period.
The candle body is an essential part of market analysis, as it represents the opening and closing price for a certain time period. So, with the body, traders analyse and understand the price range of the security traded. Moreover, the colour of the body can give traders an opinion of price rise or fall.
For example, if the price of a company's stock is studied on the candlestick chart for 15 days and it shows continuous black or red, then traders can know that the price of the stock has been falling in the market. Similarly, if the candlestick showed white or green colour, traders consider it as a sign of price rise.
In the candlestick, there are lines above and below it, which are called the wicks or shadows. The wick represents the lows and highs of the traded securities price. For better understanding, let's have a look at the below stated points:
- If the upper wick or shadow of the candle is short for a black or red candle, then it indicates that the security trade has opened near the high for the day.
- In comparison, if the upper wick of the candle for the white or green candle is short, this indicates that the security closed near high for the day's trade.
Candlestick displays the relationship between the opening, closing, high and lows of the price of the security. The body may be red or green and can have short or long wicks. This all together signals the securities market position and what traders can do to invest and earn high profits.
The candlestick has bullish and bearish chart patterns that are studied by comparing the candlestick charts of previous days with current days. There are several bullish and bearish patterns in the market. A trader can look into the details of each pattern and understand them thoroughly for accurate decisions.
Bullish Patterns
- Hammer
- Inverse Hammer
- Bullish Engulfing
- Piercing Line
- Morning Star
- Three White Soldiers
Bearish Patterns
- Hanging Man
- Shooting Star
- Bearish Engulfing
- Evening Star
- Three Black Crows
These are the candlestick patterns that are frequently used in market analysis and help traders have successful investing. Knowing all the candlestick chart patterns will help easily decode the market changes and the candlestick.
Conclusion
The financial markets have been scary for many beginners, but with the tools and trading platforms, the process has become quite easy. Traders can create their trading accounts with online brokers and use their services of trading tools, analysis, research, and trading platforms to make an investment.
This gives them a prediction of the market; candlestick is one of the best indicators of the trading platform. Through the candlesticks, formed traders can study the market fluctuations and earn profits with their accurate decisions. However, traders can use other indicators and tools along with it for a confident and successful trade.
About the Creator
keith cooper
https://trendingbrokers.com/
Keep reading
More stories from keith cooper and writers in 01 and other communities.
How to Invest in Bitcoins?
Bitcoins The financial market is huge and has several markets to invest in; the cryptocurrency market is the most recent trading market introduced in 2009. The market is new and has been excellently accepted by the investors. Bitcoin was the first cryptocurrency that was established in the financial market in 2009. Digital currency since then has become a popular trading instrument.
By keith cooper2 years ago in 01
Crafting Harmony: principles of Home interior Design
: In the realm of home interior design, every corner, color, and piece of furniture holds the power to transform a space into a sanctuary that reflects one’s personality and lifestyle. As we embark on this journey of crafting spaces that resonate with warmth and harmony, let’s delve into the fundamental principles of home interior design and explore the elements that contribute to creating inviting and aesthetically pleasing environments.
By PATRICK MWANGI NJOROGE3 days ago in 01
Best Guide To Choose An IOS App Development Company
Are you thinking of developing a breakthrough app for the iOS platform? Choosing the best iOS app development company is a key decision that can have a big impact on your project's success. With so many options accessible, it's critical to make an informed decision. In this tutorial, we'll walk you through the most important elements to consider when choosing the right iOS app development partner.
By Matthew Brain6 days ago in 01


Comments
There are no comments for this story
Be the first to respond and start the conversation.