
How to Build Low-Latency Data Infrastructure
Discover the process of creating real-time data processing systems. Learn about potential challenges and costs.


Certain applications can tolerate a delay, waiting for polished reports to arrive the next morning. Others simply cannot afford that luxury.
Consider the stakes: a fraud detection system during a transaction, a trading platform where displayed prices are obsolete by the time they reach the screen, or a logistics tracker showing a vehicle as "on schedule" when it has actually been stationary in the wrong location for twenty minutes. These scenarios are not just irritating; they are costly.
This reality drives organizations toward real-time data processing solutions. The motivation isn’t merely to use buzzwords in presentations, but because latency actively degrades product value. When data lags, users endlessly refresh pages, support staff bombard engineers with questions, and managers struggle to verify accuracy across multiple tabs. I have observed this pattern repeatedly. It rarely begins with a catastrophic failure; instead, it starts as a subtle erosion of user confidence.
Real-time infrastructure allows products to respond while the information is still relevant. This capability is essential for fraud prevention, live monitoring, IoT telemetry, financial analysis, activity feeds, and automated alerts—any scenario where discovering information after the fact is insufficient.
This piece explores the mechanics of real-time data handling, the typical components of a streaming architecture, the development lifecycle, cost drivers, and common pitfalls. There is no sorcery involved; it is primarily a matter of managing pipelines, message queues, strategic compromises, and rigorous observation.
Defining Real-Time Data Processing
These systems ingest, transport, analyze, and distribute data nearly simultaneously with the occurrence of events. Whether it’s a user click, a payment status update, a sensor reading, or an executed trade, the system captures the event and immediately routes it to the necessary downstream services.
The distinction becomes clear when compared to batch processing.
Batch processing is inherently patient. It allows data to accumulate over hours, days, or weeks before executing a job to generate reports. This approach remains perfectly valid for tasks like financial reconciliation, historical analysis, monthly summaries, or data warehouse exports.
Real-time processing, by contrast, is impatient. It handles data while it is still "warm." The goal isn’t always cinematic instantaneity; a delay of a few seconds or even a minute may be acceptable depending on the context. However, the core principle is continuous flow rather than scheduled bulk transfers.
You will typically encounter three categories of systems in this space:
- Event-Driven Systems: These react immediately to business triggers such as new registrations, transactions, user interactions, errors, or state modifications.
- Streaming Analytics: These keep visualizations, alerts, and live reports synchronized as data streams in continuously.
- Operational Systems: In these contexts, any latency can directly impact revenue, regulatory compliance, safety protocols, or user trust.
Internally, the architecture of a streaming system consists of familiar components: event producers, a message broker, stream processors, storage layers, and consumers. The consumer could be anything from a public-facing dashboard or API to a notification service, a machine learning model, an admin interface, or an internal utility that, while invisible to outsiders, is critical to the team’s operations.
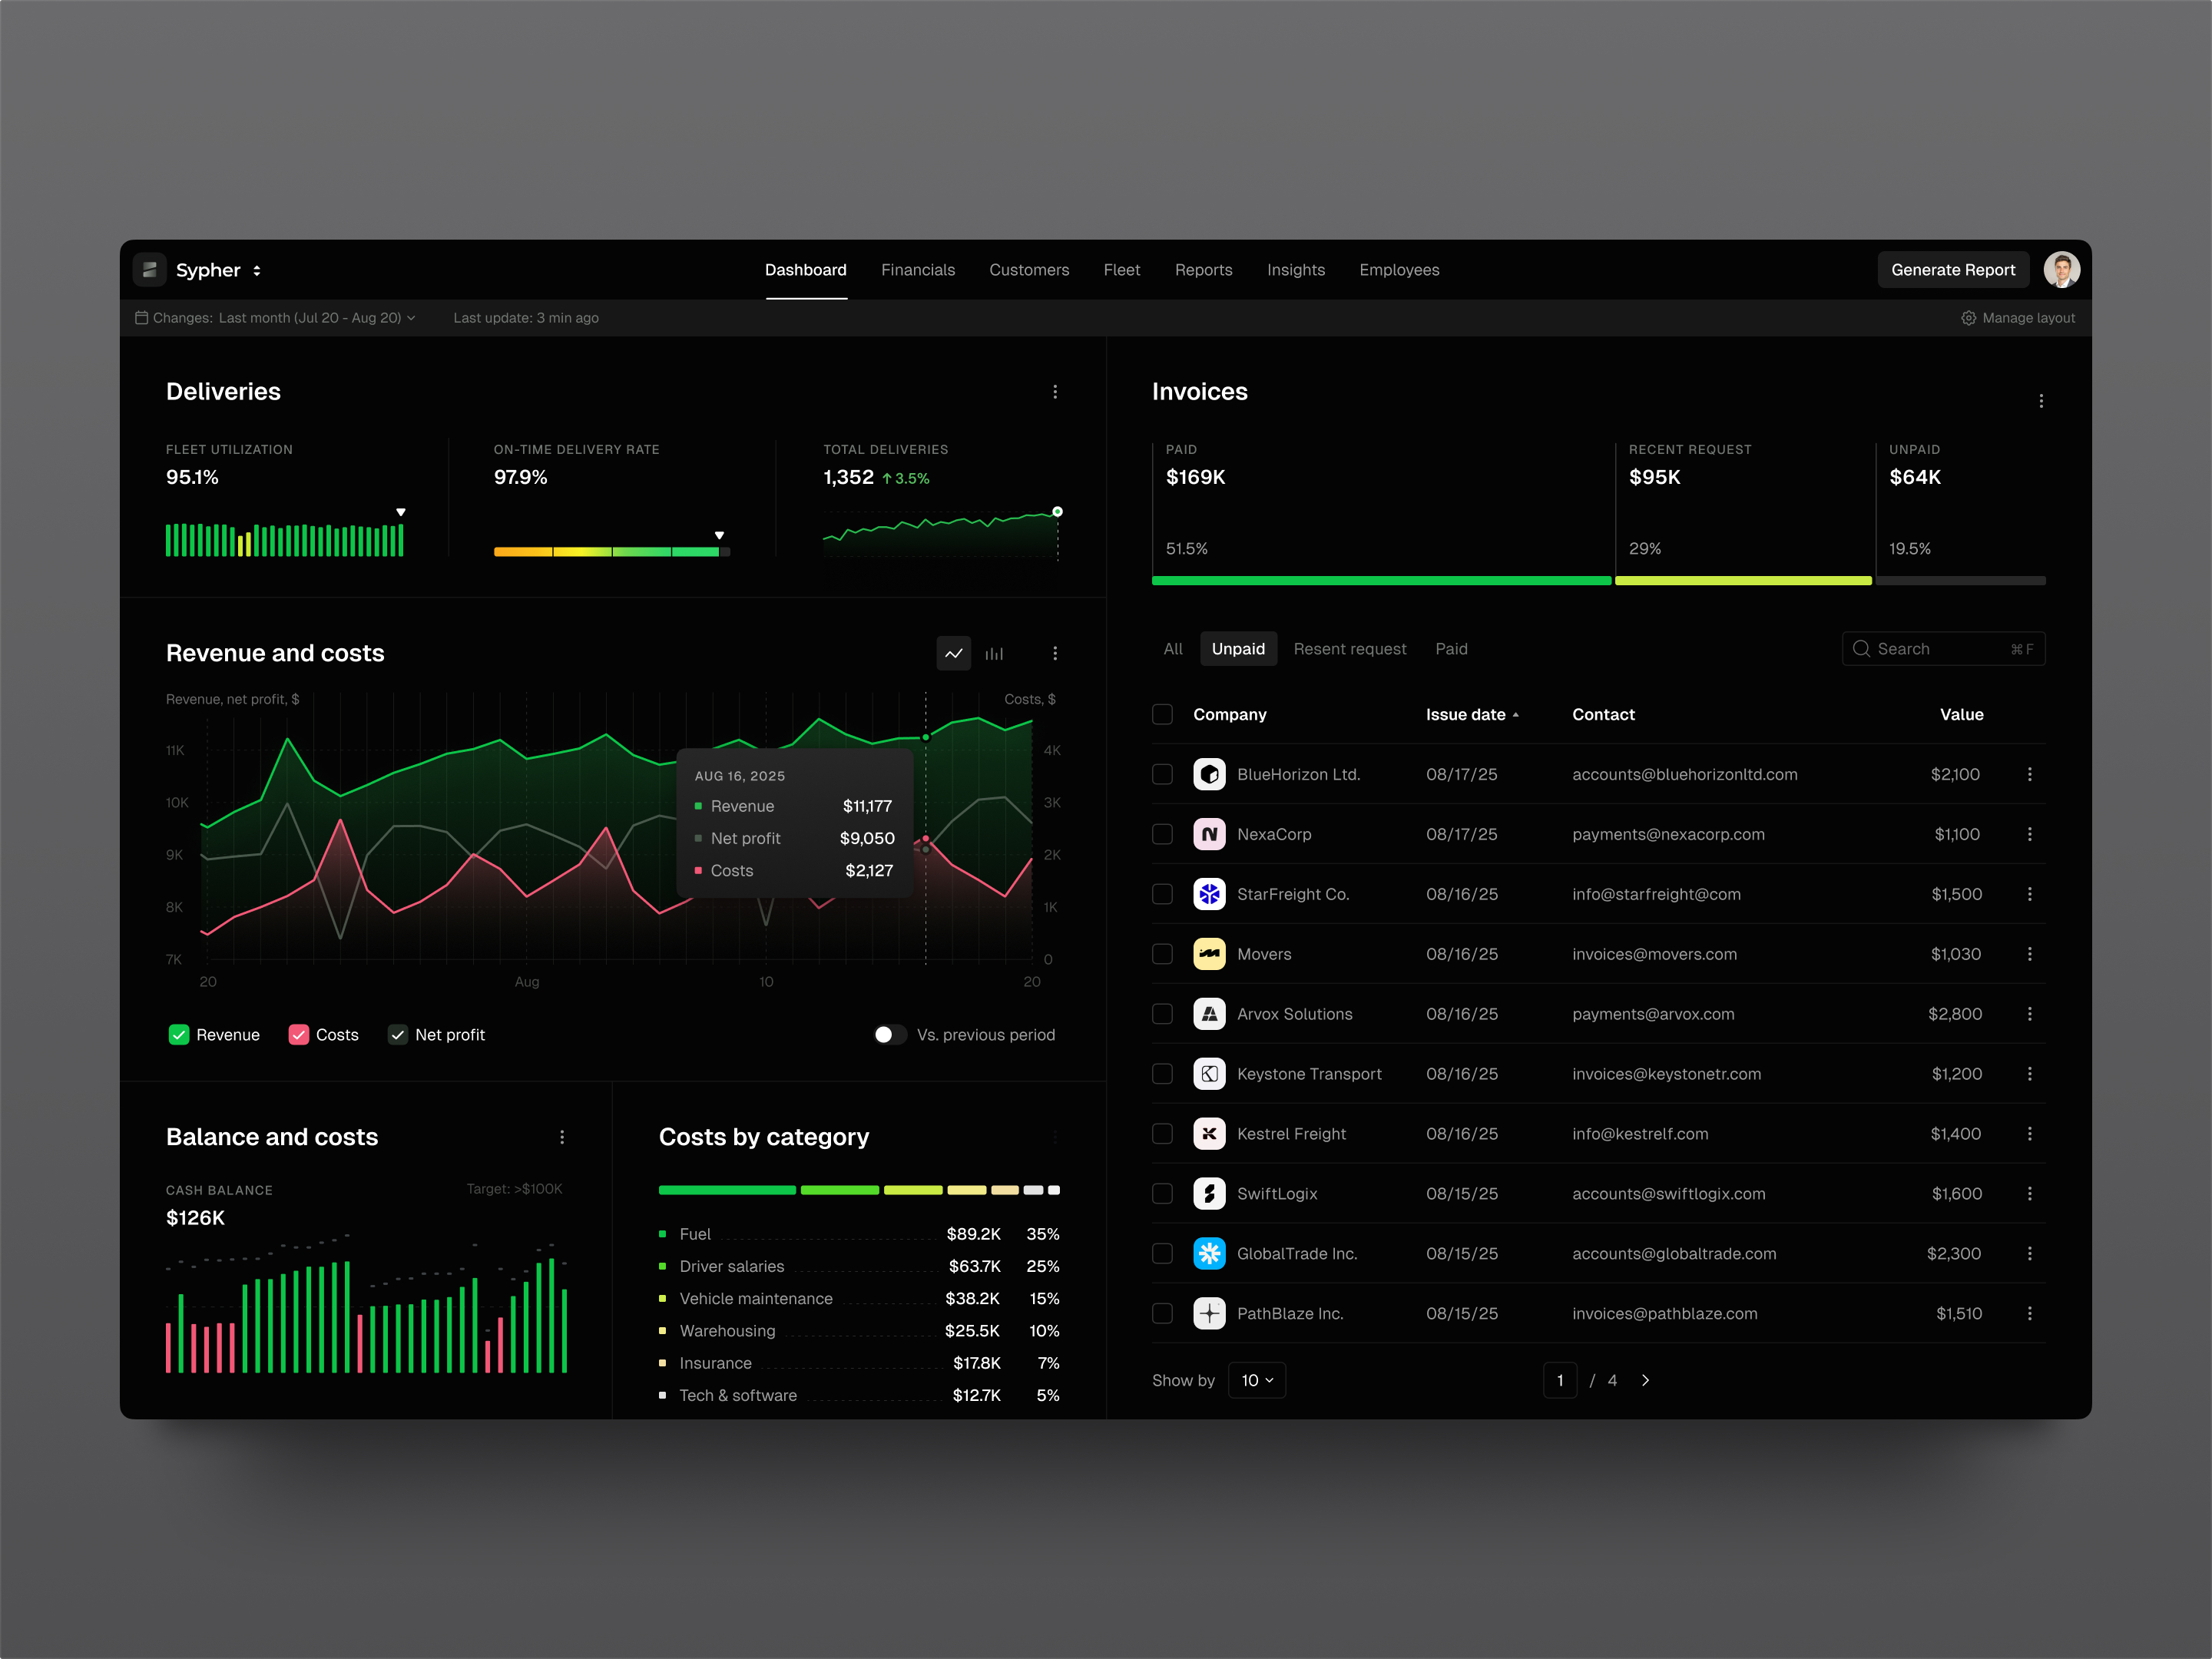
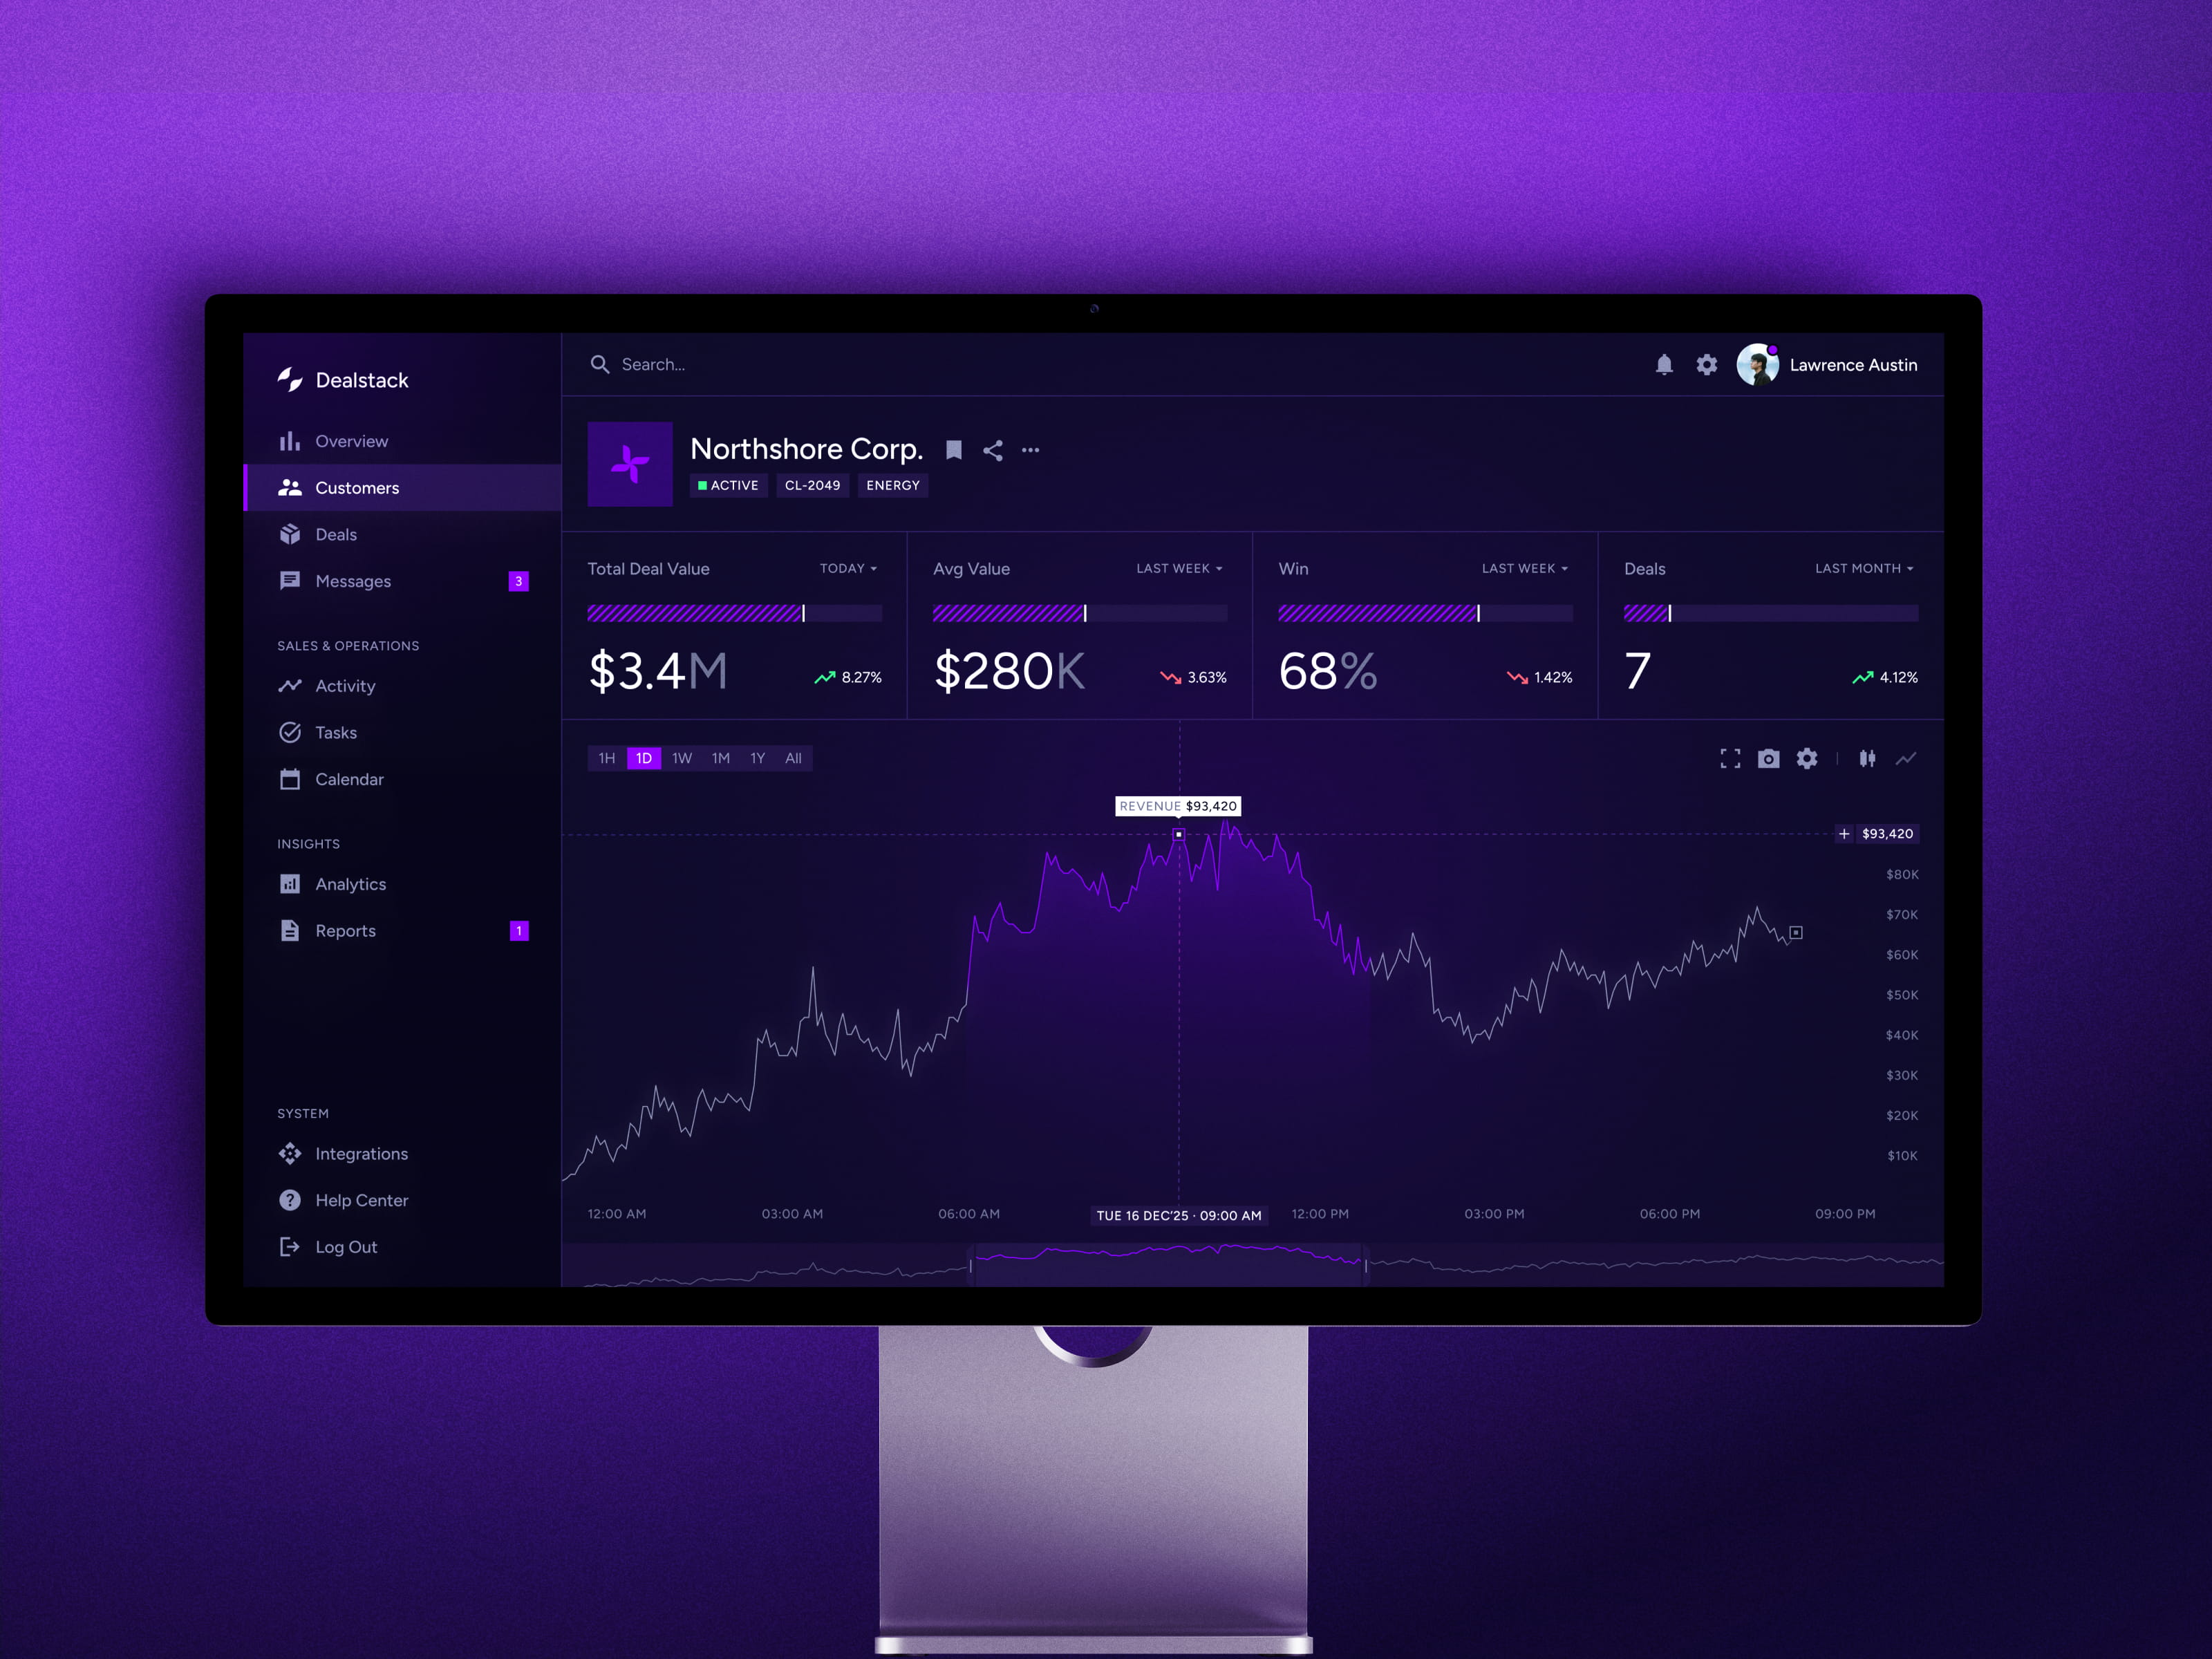
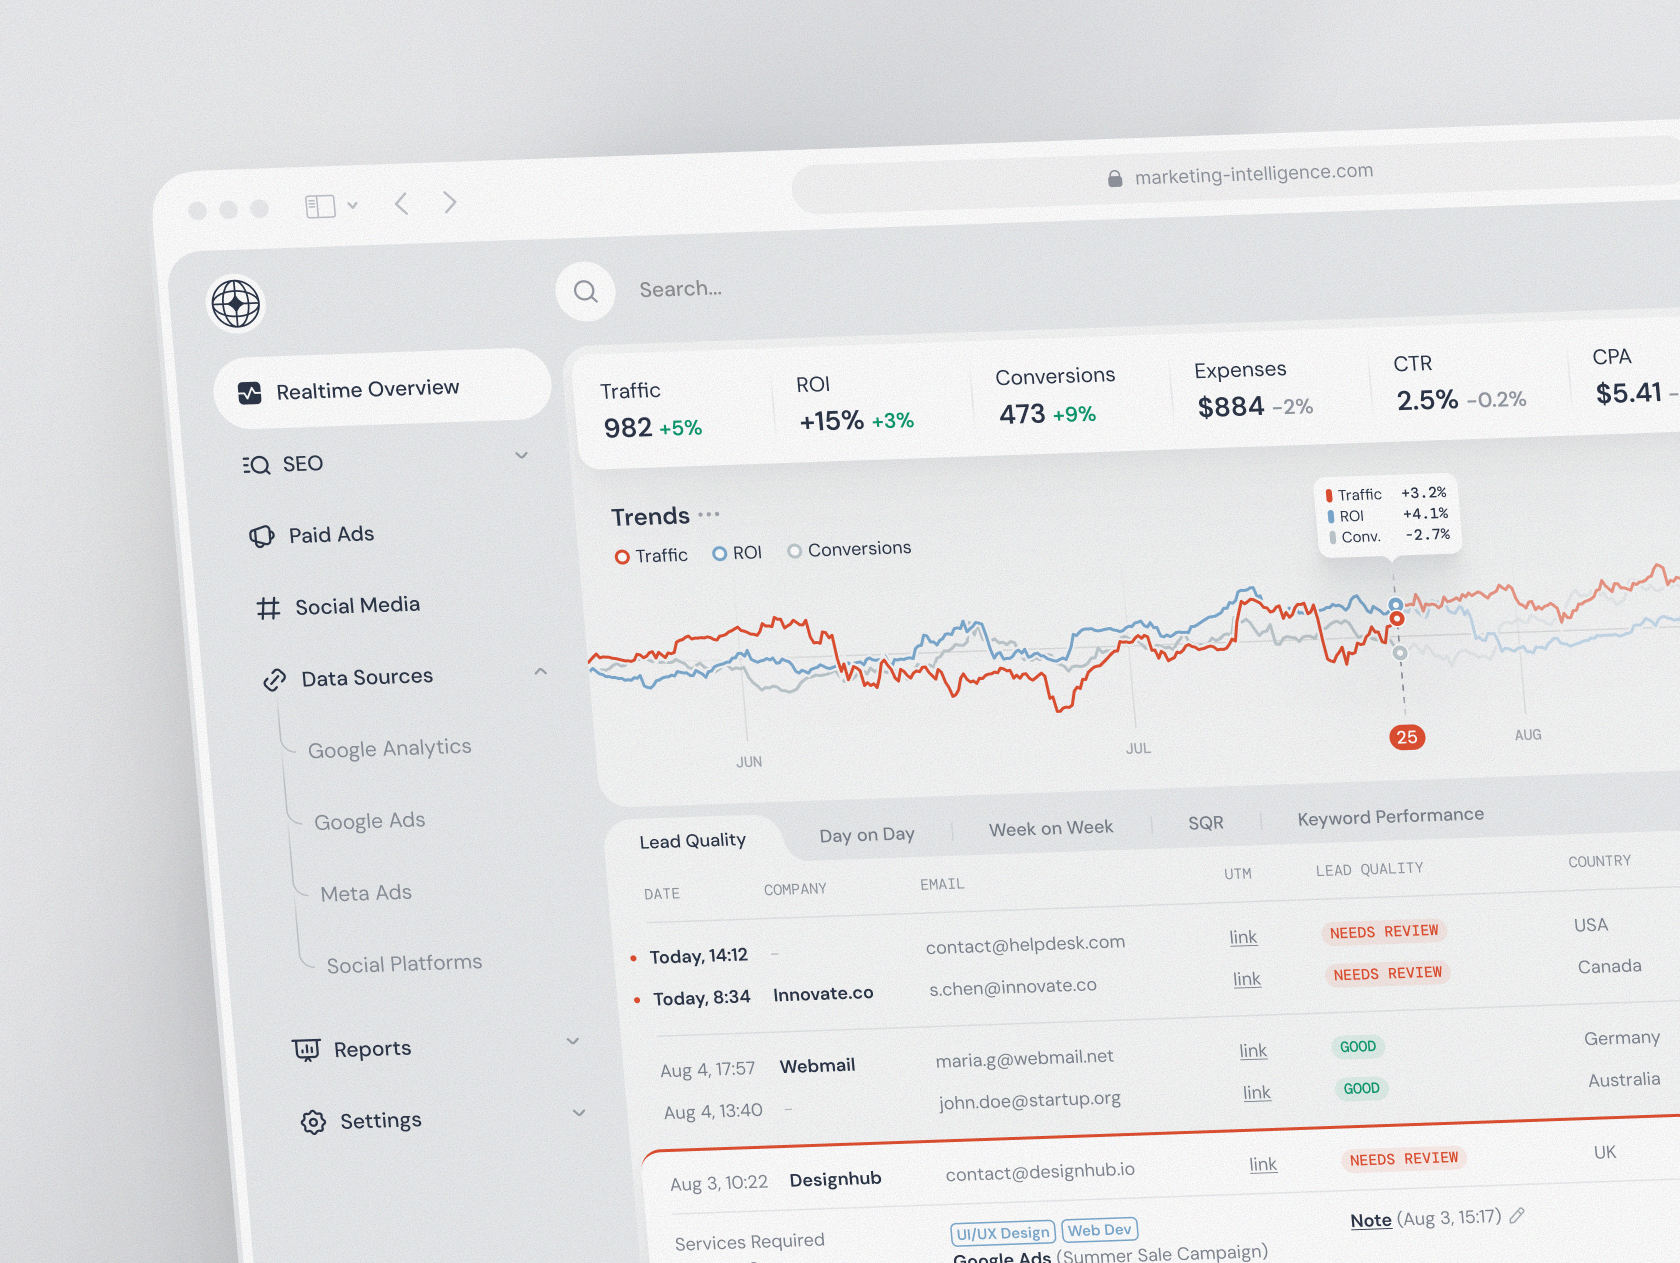
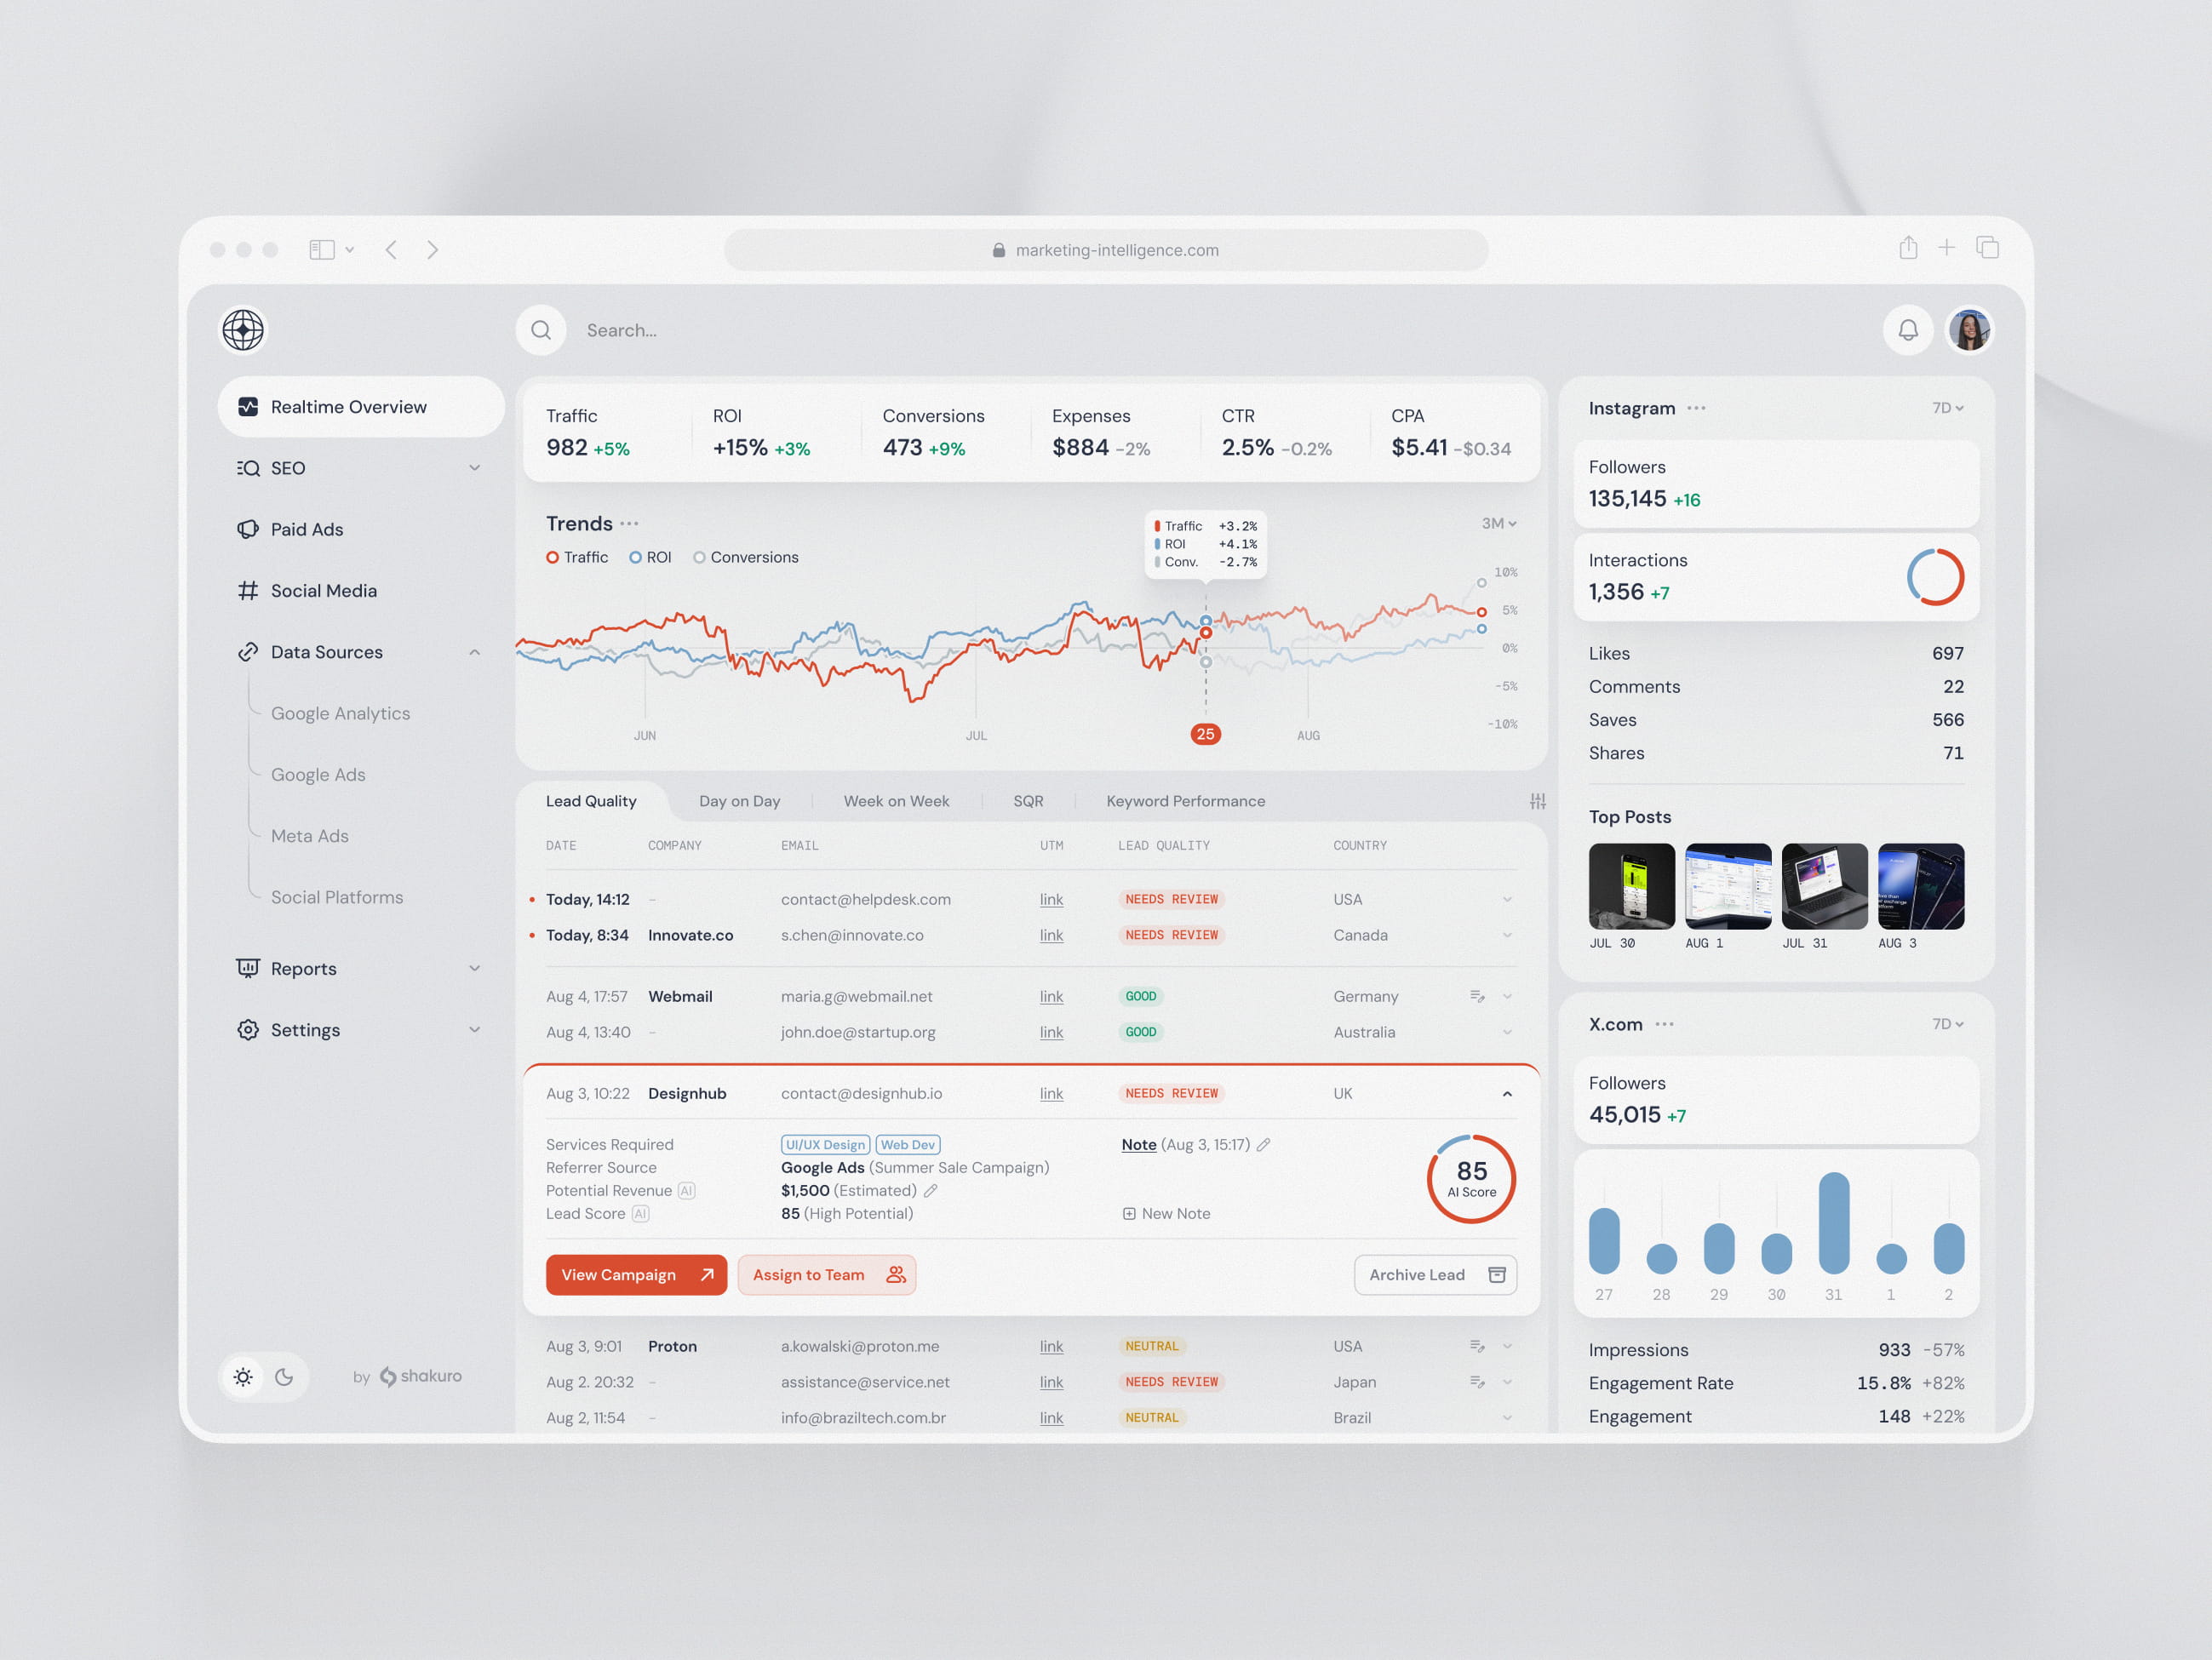
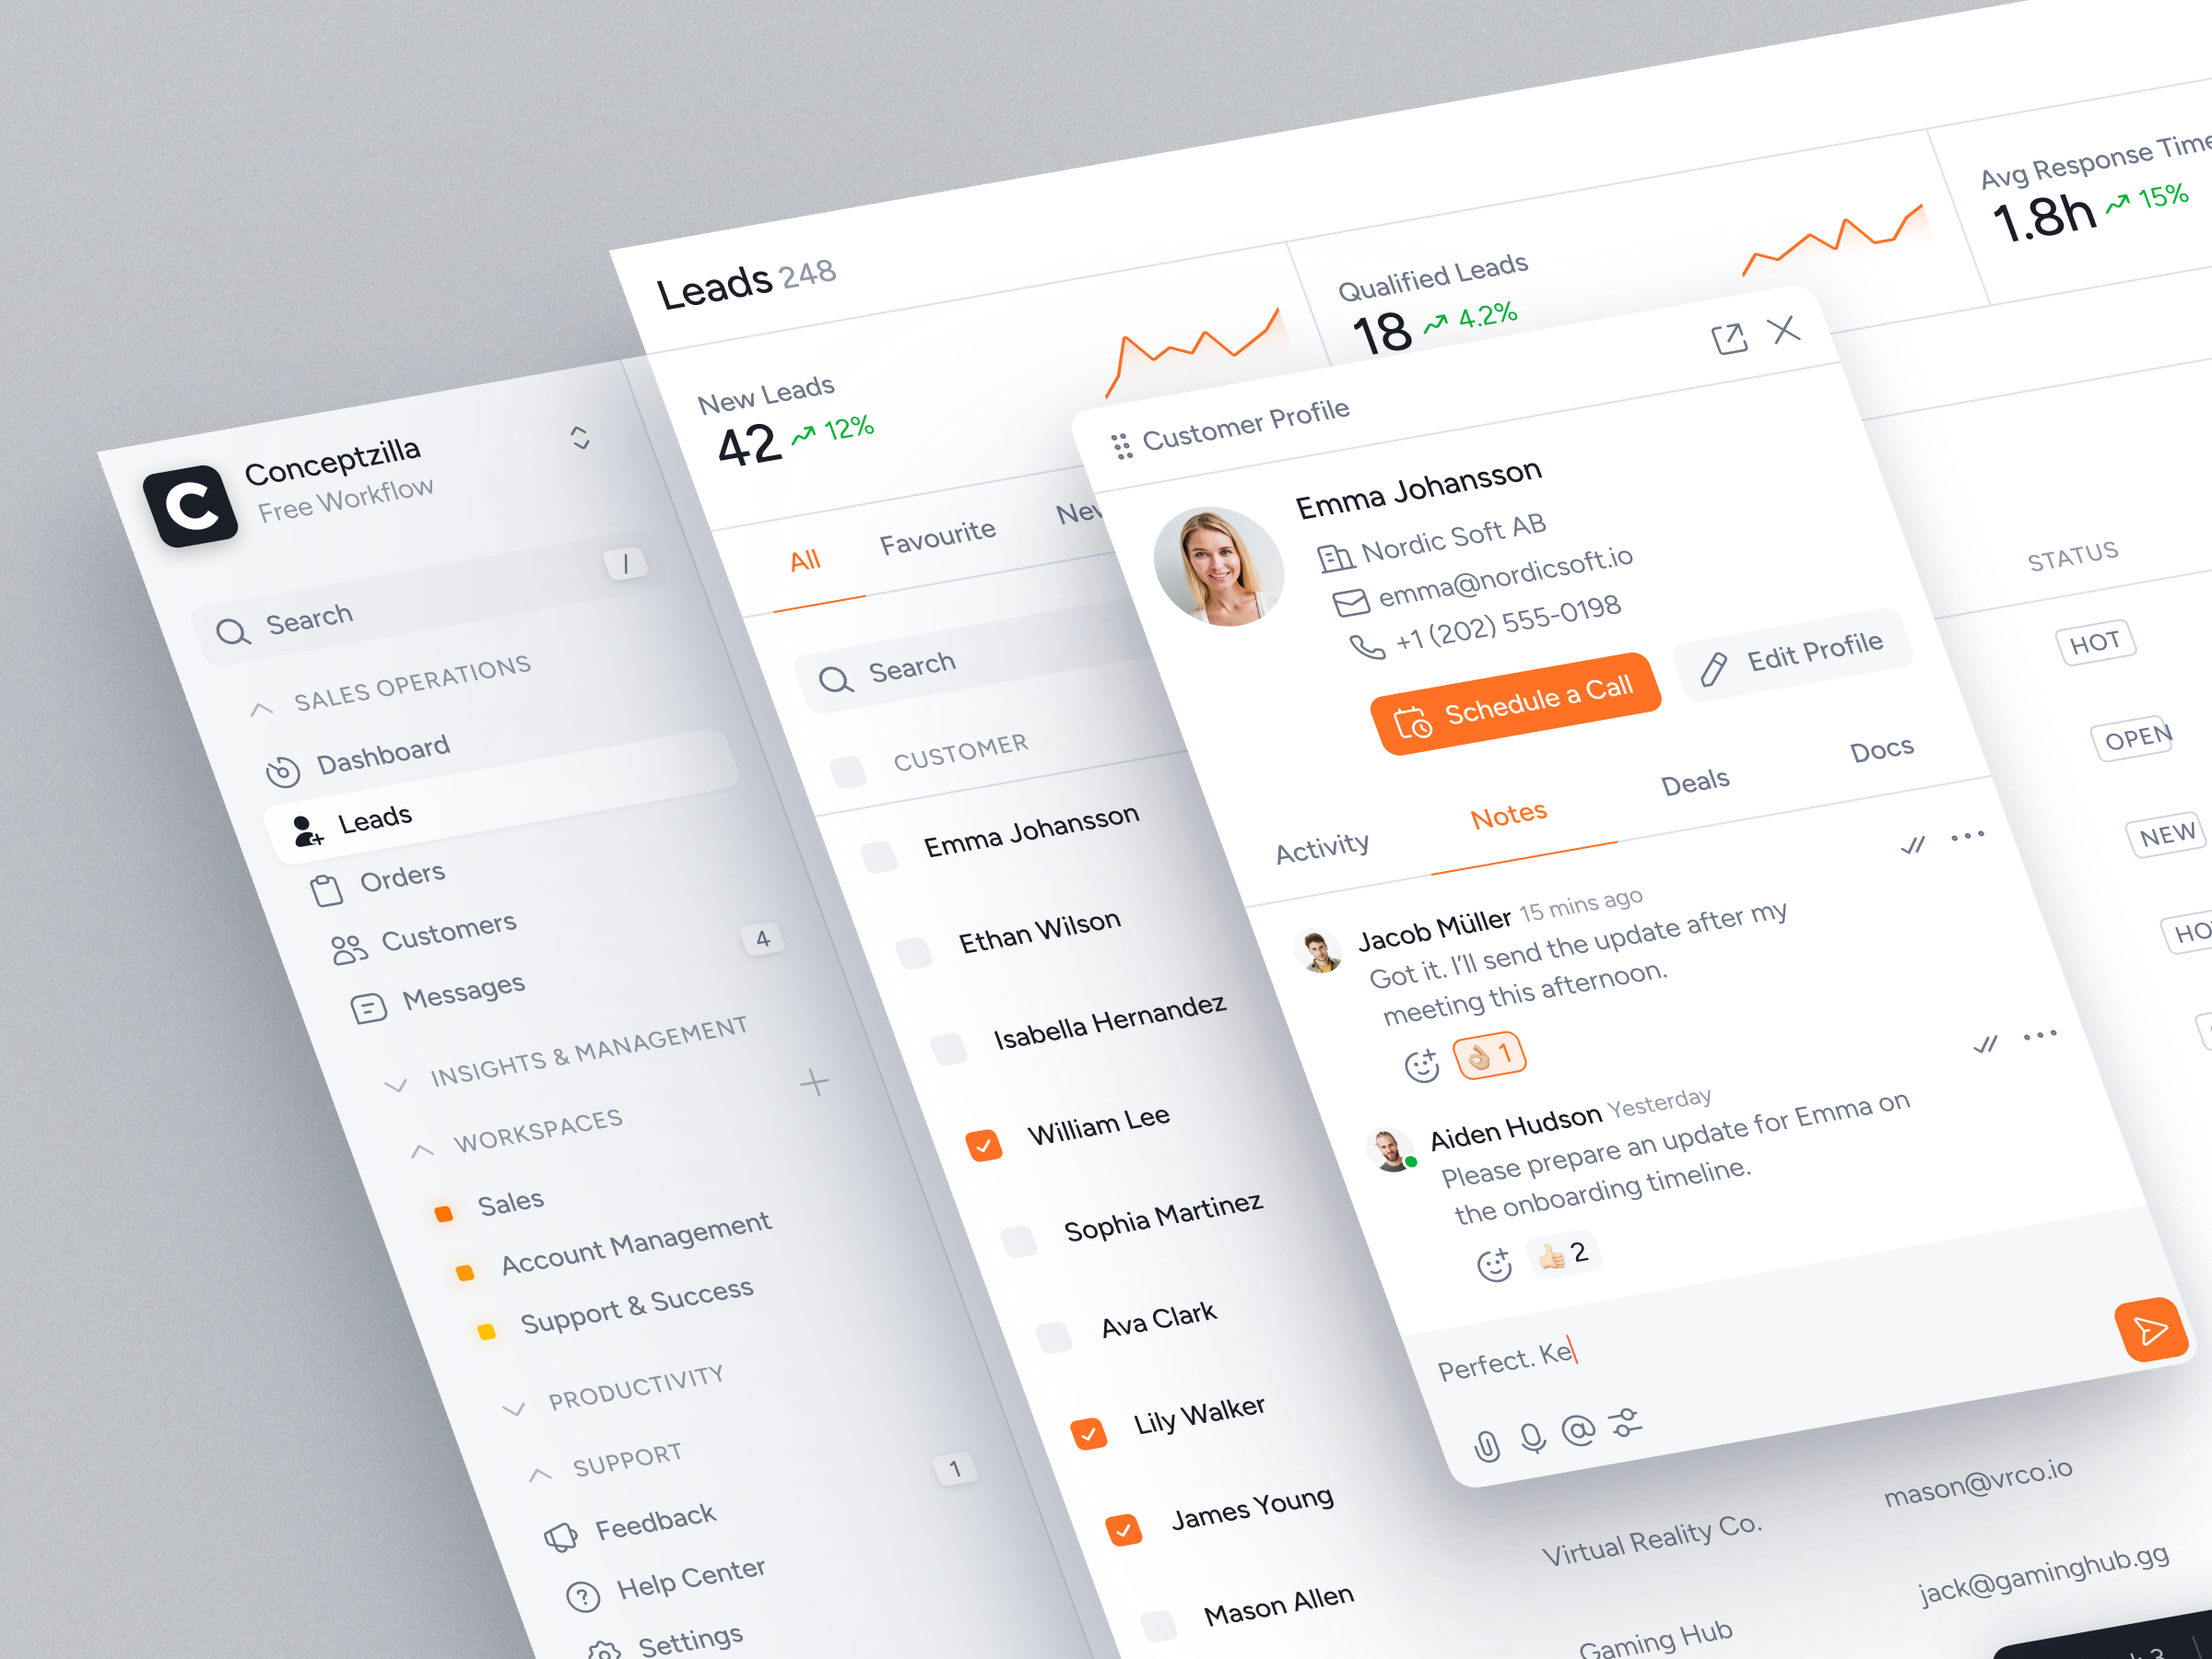
Finally, if the end result is a visual dashboard, do not neglect the user interface. A high-speed data pipeline is useless if the display is confusing. For a deeper dive into the product-specific challenges of building real-time dashboards, Shakuro’s guide on SaaS dashboard development offers valuable insights into this specialized domain.
Core Characteristics of Real-Time Data Systems
Minimizing Latency
Latency represents the gap between an event occurring and the system reacting to it. While the concept is straightforward, managing it is complex.
Many teams initially demand millisecond-level responses for every feature, but this is often unnecessary. High-frequency trading and weekly sales reporting operate in entirely different realms. For instance, fraud detection must occur before a transaction clears, whereas a SaaS usage graph remains valuable even with a 30-second lag. Aligning latency targets with actual product requirements prevents engineering efforts from becoming expensive exercises in over-optimization.
Achieving low latency is largely about eliminating inefficiencies. This involves rapid data ingestion, lightweight transformations, unclogged message queues, optimized database queries, and APIs that deliver only the specific data the interface requires, rather than dumping entire datasets. The ideal latency goal is defined by the business need, not technical maximalism.
Event-Driven Design
Traditional request-response models, where one service waits for another to reply, work well for many standard interactions. However, real-time scenarios often require a single event to trigger multiple simultaneous actions. Consider a successful payment: it might need to update billing records, refresh a user dashboard, send a notification, recalculate risk scores, and update CRM entries all at once.
An event-driven architecture allows services to publish events asynchronously, enabling other components to subscribe and react independently. This decouples systems, preventing workflows from becoming tangled chains of direct calls and allowing the product to scale more organically.
This approach is not without its challenges. It introduces complexities such as managing event schemas, handling retries, ensuring message ordering, dealing with duplicates, and maintaining visibility. Nevertheless, for many real-time applications, it is the superior choice because it allows the system to remain flexible and responsive.
Handling High Throughput
Throughput addresses a critical question: how much data volume can the system sustain before performance degrades?
A prototype handling 100 events per minute may perform flawlessly, but production environments introduce unpredictable spikes—such as mass user reconnections, bursty third-party API traffic, or nightly integration jobs. These realities can quickly overwhelm a system that looked smooth during testing.
Sustaining high throughput relies on proper broker configuration, effective partitioning, scalable worker nodes, efficient storage writes, and robust backpressure mechanisms. Sometimes the solution requires adding infrastructure; other times, it simply involves optimizing a single inefficient query. The latter is often the more satisfying fix.
Resilience and Fault Tolerance
Failures are inevitable. Message brokers restart, processors crash, network routes become unstable, and downstream APIs time out during peak traffic. Designing for these eventualities is a core part of building real-time systems.
Fault tolerance ensures that the system can recover gracefully without data loss or systemic collapse. Key strategies include implementing retry logic, using dead-letter queues for failed messages, establishing checkpoints, maintaining replayable logs, ensuring idempotent handlers, and setting up clear alerting systems.
A real-time pipeline may appear robust in a controlled demo but prove fragile in production. Issues often surface subtly, such as when a slow consumer causes a message queue to expand uncontrollably. Anticipating these failure modes is essential for long-term stability.
Effective Data Delivery
Processing data is only half the battle; it must also be delivered effectively to its intended destination.
Recipients might include operational dashboards, customer-facing analytics pages, webhooks, alerting services, or mobile applications. The delivery mechanism should align with how "live" the data needs to feel. WebSockets are ideal for highly interactive interfaces, while Server-Sent Events (SSE) offer a simpler alternative for one-way updates. Even traditional polling, though less glamorous, can be the right tool for certain use cases.
The key is to match the delivery method to the user’s actual needs. Pushing updates ten times per second for a metric that only changes every five minutes is unnecessary overhead. Choosing the right tool ensures efficiency without sacrificing usability.
Architecture of Real-Time Data Systems
The Streaming Pipeline Structure
Most real-time systems adhere to a standard flow:
Event Source → Message Broker → Stream Processor → Storage → Consumer
Data originates from various sources, such as user actions, IoT devices, internal services, or external APIs. The message broker ingests this data, organizing it into manageable streams. Next, stream processors validate, filter, enrich, or aggregate the information. Relevant data is then persisted in storage, while consumers retrieve and utilize the final output.
While this linear model appears straightforward on paper, operational reality is more complex. The primary challenge lies in pinpointing bottlenecks. Is the ingestion layer sluggish? Is the broker experiencing lag? Is a processor stalled by a malformed payload? Or is the frontend overwhelming the backend with requests? Without comprehensive visibility at every stage, troubleshooting becomes a process of educated guessing rather than precise diagnosis.
Message Brokers
Brokers act as the intermediary transport layer between data producers and consumers. Two prominent examples are Apache Kafka and RabbitMQ, though they serve distinct purposes.
Kafka is typically chosen for high-throughput scenarios requiring durable, replayable event logs and support for multiple consumers reading the same historical data. Conversely, RabbitMQ is often preferred for complex routing, task queues, and workflows where specific delivery guarantees are more critical than long-term event retention.
The choice of broker fundamentally defines the system’s characteristics. It influences scalability strategies, recovery mechanisms, the ability to replay events, consumer decoupling, and the ease of future integrations. Selecting the wrong broker can complicate these aspects significantly.
Stream Processing Engines
Stream processors perform computations on data in motion. Their tasks include cleaning raw events, joining multiple data streams, calculating rolling averages, enriching records with additional context, detecting anomalies, or formatting data for storage.
For complex requirements involving windowing, stateful joins, and high-volume processing, robust platforms like Apache Flink or Spark Streaming are common choices. However, for smaller-scale applications, lightweight services built with Python or Node.js may suffice. A common pitfall is over-engineering; teams sometimes introduce heavy infrastructure like Kafka, Flink, and Kubernetes for simple Minimum Viable Products (MVPs), creating unnecessary complexity akin to building a banking core system for a basic app.
The guiding principle should be proportionality: employ dedicated stream processing platforms only when the workload demands it. For lighter tasks, maintain a simpler architecture.
The Storage Layer
Storage is rarely a single decision but rather a combination of specialized databases tailored to different data needs.
- Raw Events: Often stored in object storage (e.g., S3) to enable future auditing or reprocessing.
- Aggregated Metrics: Typically housed in systems optimized for fast reads, such as PostgreSQL, ClickHouse, or specialized time-series databases.
- Short-Term State: Frequently managed in in-memory stores like Redis for low-latency access.
- Flexible Structures: NoSQL databases may be better suited for semi-structured or evolving data schemas.
The optimal storage strategy depends on usage patterns. Compliance audits require immutable, historical records, while live dashboards need rapid, filtered query responses. Internal anomaly detection systems might prioritize event replayability over immediate read speed.
Additionally, storage choices are influenced by team expertise. A database with zero licensing fees is not truly "free" if the team lacks the skills to operate and maintain it effectively. Operational complexity is a hidden cost.
API and Delivery Layer
This layer exposes processed data to the end product, serving as the bridge between backend systems and user interfaces.
Requirements vary by use case:
- Live Dashboards: The backend must deliver updates quickly without overwhelming the database with excessive queries.
- Operational Tools: Security features like permissions and audit logging are as critical as performance.
- SaaS Analytics: Strict tenant isolation is mandatory to prevent data leakage between customers—a failure mode that is unacceptable in multi-tenant environments.
Technological choices here matter. For instance, FastAPI is a strong candidate for Python-based backends, offering asynchronous performance and automatic documentation. Comprehensive development services, such as those provided by Shakuro, often encompass this entire layer, including backend architecture, API design, frontend integration, and the user-facing components that ultimately deliver value.
The Development Lifecycle for Real-Time Data Systems
1. Clarify the Business Objective
Begin with the core business problem, not the technology stack. Avoid jumping straight to cloud providers or message brokers. Instead, ask fundamental questions:
- What specific event needs tracking?
- Who requires this information?
- What is the acceptable latency threshold?
- What are the consequences of delayed or inaccurate data?
These seemingly simple inquiries prevent costly missteps. For example, an executive dashboard might tolerate a slight delay, whereas a payment fraud engine cannot. Similarly, a patient monitoring system demands a different reliability standard than a marketing analytics tool.
Before selecting tools, clearly define requirements for latency, data volume, sources, retention policies, security, and the specific decisions the system supports. Without this clarity, teams risk spending weeks optimizing features that provide little actual value.
2. Architect the Solution
Once the use case is defined, design the system structure.
Some applications benefit from a purely event-driven model, while others perform better with a hybrid approach—using batch processing for historical analysis and streaming for real-time insights. This hybrid model is common and often more practical than forcing every data point into a real-time stream.
This phase also involves defining event schemas, assigning ownership, configuring broker topics or queues, establishing processing rules, determining storage strategies, and selecting delivery mechanisms. While less glamorous than coding, thorough architectural planning saves significant effort downstream.
3. Select the Technology Stack
Choose technologies that align with both the workload and the team’s expertise.
- Python: Ideal for data processing, automation, backend services, and integrations.
- Node.js: Well-suited for WebSocket handling and event-heavy application logic.
- Infrastructure Tools: Kafka, RabbitMQ, Flink, Spark Streaming, Redis, PostgreSQL, MongoDB, and time-series databases each serve specific roles depending on throughput, durability, and query needs.
For API-centric products, FastAPI is a strong candidate due its asynchronous capabilities and automatic documentation generation. For broader backend and pipeline development, Python offers versatility across ingestion, processing, and service layers.
A useful heuristic: if the team cannot justify the inclusion of a specific tool, it likely adds unnecessary complexity and should be reconsidered.
4. Construct the Pipeline
Building the pipeline involves configuring event ingestion, setting up the message broker, developing processing services, implementing schema validation, establishing storage, and enabling data delivery.
This stage requires addressing concrete operational details:
- Which data fields are mandatory?
- How are invalid events handled?
- Can the system manage duplicate messages?
- How is consumer lag detected?
- Where do failed messages go (e.g., dead-letter queues)?
Observability must be built in from day one. Key metrics such as event volume, processing latency, broker lag, retry rates, queue depth, downstream errors, and delivery success rates should be visible. Without this visibility, troubleshooting production issues becomes a prolonged exercise in guesswork.
5. Integrate with Product Interfaces
Real-time infrastructure does not exist in isolation; it powers dashboards, APIs, alerting systems, analytics platforms, admin panels, mobile apps, and sometimes legacy systems.
Product thinking is crucial here. A technically sound pipeline fails if the resulting dashboard is cluttered or alerts are vague. Users need sufficient context to take action.
For data-intensive interfaces, user experience (UX) is an integral part of the system. Elements like filters, empty states, loading indicators, drill-down capabilities, permission controls, and clear chart labels significantly impact usability.
6. Validate with Load Simulation
Testing only the "happy path" invites future failures.
Simulate realistic stress conditions:
- Inject traffic spikes.
- Send duplicate events.
- Introduce artificial delays.
- Simulate consumer failures.
- Degraded broker performance.
- Rapid dashboard updates to test readability.
- Verify that alerts trigger appropriately without spamming users.
Load testing is not exclusive to large enterprises. Even Minimum Viable Products (MVPs) can collapse under unexpected traffic surges from successful launch campaigns. Proactive simulation prevents these surprises.
7. Deploy and Maintain Observability
Deployment marks the start of the system’s operational life.
Continuously monitor key performance indicators: latency, throughput, broker health, processor lag, storage efficiency, API response times, and delivery success rates. Implement comprehensive logging and distributed tracing to help engineers quickly identify not just that a failure occurred, but where and why.
For ongoing stability, professional support services can manage cloud infrastructure, CI/CD pipelines, monitoring, load testing, reliability engineering, and routine maintenance tasks. These efforts ensure the product remains stable and performant in production.
Navigating Common Pitfalls in Real-Time Data Systems
The Illusion of Average Latency
Relying on average response times can be misleading. A dashboard might display a healthy average latency, masking the fact that individual users are experiencing significant delays.
This is why monitoring percentiles (such as P95 or P99) is critical. A system with a 100ms average latency but occasional 10-second spikes will still feel unresponsive and unreliable to users. These spikes often stem from traffic surges, sluggish consumers, broker backlogs, cold starts in serverless environments, inefficient database queries, or temporary issues with downstream services.
Ensuring Data Consistency
Real-time data is inherently messy. Events do not always arrive in a predictable manner.
Common issues include late arrivals, duplicate messages, out-of-order sequencing, or missing fields due to outdated client applications. If the system is not designed to handle these irregularities, the resulting data anomalies can erode user trust. Once stakeholders lose confidence in a dashboard’s accuracy, rebuilding that trust is difficult.
To mitigate this, establish clear data handling rules early:
- Which timestamp defines the event time?
- How are duplicates detected and resolved?
- Can erroneous events be corrected or retracted?
- What serves as the single source of truth?
Resilience Against System Failures
In distributed systems, failures are inevitable. The objective is not to prevent every glitch—an impossible task—but to ensure graceful recovery without data loss, user confusion, or unnecessary operational overhead.
Effective strategies include implementing retry mechanisms, using dead-letter queues for failed messages, maintaining replayable logs, keeping regular backups, designing for graceful degradation, and setting up precise incident alerts. Additionally, keep the architecture simple and understandable. A complex system that only one engineer can debug represents a significant single point of failure.
Managing Architectural Complexity
Stream processing ecosystems involve numerous moving parts: message brokers, schema registries, processors, storage layers, APIs, dashboards, access controls, monitoring tools, and deployment pipelines. This complexity accumulates quickly.
Adopting disciplined practices helps manage this sprawl:
- Maintain an event catalog.
- Enforce data contracts.
- Keep architecture diagrams and runbooks up-to-date.
- Define clear ownership for each component.
- Use consistent, descriptive naming conventions.
While naming standards may seem trivial during planning, poor choices create long-term maintenance burdens. Furthermore, ensure that real-time streams integrate smoothly with broader data strategies. Live data pipelines, analytical warehouses, and long-term reporting systems should complement rather than conflict with each other.
The Value of Partnering with Real-Time Specialists
From the outside, real-time data engineering appears straightforward: data flows in, gets processed, and updates a display. However, this simplicity is an illusion. Once development begins, complex operational challenges emerge. How do you manage duplicate events or out-of-order messages? Which database optimizes dashboard performance? How do you simulate traffic spikes for testing? Who governs event schemas? How is multi-tenant data isolation enforced? What happens when the message broker is healthy, but a single consumer creates a bottleneck?
An experienced development partner navigates these complexities by providing:
- Purpose-Built Architecture: Designing event-driven systems that align precisely with your product’s workflow rather than forcing generic solutions.
- Strategic Technology Selection: Choosing the right combination of message brokers, stream processors, storage layers, and API frameworks tailored to your specific use case.
- Efficient Development: Building low-latency systems that remain practical and maintainable, avoiding the trap of over-engineering an MVP into an overly complex "science project."
- Realistic Stress Testing: Validating platform stability under realistic load conditions to uncover weaknesses before they impact users.
- End-to-End Integration: Seamlessly connecting backend data pipelines with frontend dashboards, alerting systems, and user interfaces.
- Proactive Operational Planning: Establishing monitoring, support protocols, and scaling strategies early, preventing chaotic firefighting once the system goes live.
This expertise is particularly critical for industries such as fintech, SaaS, healthcare, e-commerce, logistics, and IoT, where data latency or inaccuracies translate directly into financial loss, compliance risks, or degraded user trust.
Conclusion
At its core, real-time data processing is about converting events into immediate, actionable insights. Whether it’s a user interaction, a sensor reading, a transaction update, or a service signal, the system must capture, process, and route this information while it remains relevant.
While the concept is straightforward, the execution is challenging. The true difficulty lies in maintaining reliability, clarity, and cost-efficiency as the product scales.
To succeed, focus on fundamentals:
- Start with the business need: Define the specific use case and the latency thresholds that actually impact value.
- Choose manageable tools: Select technologies your team can effectively operate and maintain.
- Prioritize visibility: Implement robust observability from day one to detect issues early.
- Test for failure: Simulate edge cases and high-load scenarios to ensure resilience.
- Focus on the end user: Remember that the ultimate judge of the system’s success is the person viewing the dashboard. If the interface doesn’t provide clear, timely context, the underlying engineering excellence goes unnoticed.
About the Creator
Shakuro
We are a web and mobile design and development agency. Making websites and apps, creating brand identities, and launching startups.
Enjoyed the story? Support the Creator.
Subscribe for free to receive all their stories in your feed.
Comments
There are no comments for this story
Be the first to respond and start the conversation.