
How a Routine Health Check Helped Take Down Outlook, Copilot, and Teams
A few failed servers should not become a global outage. Here is the feedback loop that turned a safeguard into an accelerator.
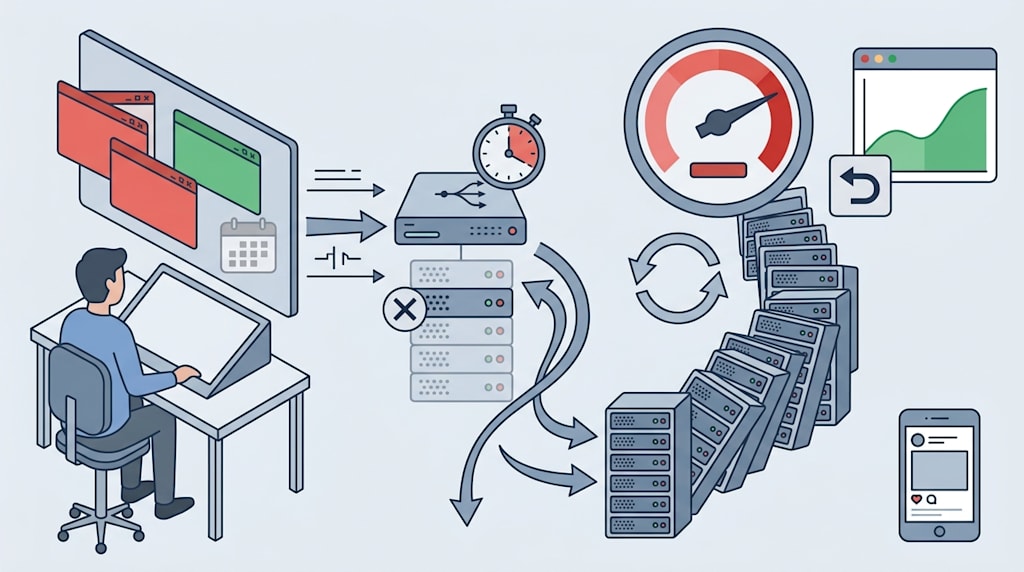
At nine in the morning, an ordinary user opened a computer. Outlook was spinning. Copilot showed “temporarily unavailable.” The Teams chat box still accepted typing, but when the user clicked the calendar to schedule a meeting, the button was grayed out. Three windows sat side by side on the screen: two red, one green.
That same day, Musk reposted the outage news on X with two words: “beyond embarrassing.” Within half an hour, the repost had more engagement than all his other posts that day. It sat in the feed beside Microsoft’s official incident notice MO1550821, one with an exclamation mark, the other with a ticket number.
In its November 13 update, Microsoft engineers confirmed three things. A batch of servers failed automated health checks and was judged unavailable. After those servers left service, their traffic shifted to the remaining servers, whose load rose. On some servers, the processes that establish secure connections became overloaded and stopped handling requests. A recent network configuration change also showed a time correlation with the start of the failure, and Microsoft began rolling it back.
Each statement is easy to understand alone. Together they form a cascading-failure chain.
1. Three products broke; one queue jammed
The Outlook calendar and the Teams meeting button call the same Exchange Online interface behind the scenes. Copilot reads email and calendars to summarize and arrange tasks, so it waits in the same queue. Teams chat still worked because chat uses another message channel and does not pass through the connection process that was failing.
Users saw three products fail at once. Engineers saw a local blockage on a shared dependency chain, smoking outward through calendar, email, meetings, and Copilot data access.
2. Health checks ask “are you still alive?” every few seconds
A large cloud application runs on hundreds or thousands of servers. A load balancer distributes user requests among them. Who gets a request depends on health checks.
The logic is simple. Every few seconds, the load balancer sends a test request. If there is no response within three seconds, it removes that machine from the list and sends its traffic to the remaining machines. Microsoft’s Azure Load Balancer documentation states that backend instances failing health checks stop receiving new connections.
This mechanism isolates bad nodes. If one machine breaks, remove it, and users do not notice. The mechanism has a precondition: only a minority of machines are removed. If too many leave at once, the remaining machines cannot carry the load. The health check then turns from a safeguard into an accelerator.
3. 100 servers, 8,000 requests, 30 removed
Suppose 100 servers each handle 100 requests per second. Total capacity is 10,000 requests per second. Actual traffic is 8,000 per second, leaving 20% headroom.
Now 30 servers fail health checks and are removed. The remaining 70 have capacity for 7,000 requests per second. Traffic is still 8,000. The shortfall is 1,000.
Requests queue. Responses slow down. Clients time out and reconnect. Users refresh. Mobile background sync triggers again. Requests stack up like echoes. More servers fail health checks because they cannot keep up, and they are removed too. 70 becomes 60. 60 becomes 50.
At this point, an ordinary user feels that Outlook has slowed down and clicks refresh.
This is the cascading-failure feedback loop: remove nodes, capacity drops, requests queue, timeouts trigger retries, load rises, more nodes are removed. The health check followed its rule. The rule assumed that only a minority would ever be removed.
4. Redundancy exists, but replicas can share the same configuration
Microsoft has redundancy. Multiple replicas, multiple availability zones, and multiple nodes appear throughout Azure architecture documents. Redundancy works when failures stay uncorrelated.
Three servers run three replicas. If all three read the same network configuration, one configuration change can make all three fail together. Three nodes sit in three racks. If all three share the same overload threshold for the connection process, one traffic surge can stall all three. Replicas help only when their failures stay independent. Shared configuration and shared thresholds create shared failure.
In this outage, health-check failures, traffic shifting, connection-process overload, and configuration rollback happened in the same time window. Those four events formed one chain and fed one another. The redundant nodes did not fail at the same moment, but the same chain pulled them into the same feedback loop.
5. If we could go back to before November 12
Here are three actions that can be checked at the next change review.
First, add gradual removal to health checks. Do not remove 30 servers at once. Remove 10% first, watch the load on the remaining nodes and the error rate of the connection process, then decide whether to continue. Tie the removal threshold to capacity headroom. When headroom falls below 20%, pause automatic removal and switch to manual judgment. A health check’s “no response within three seconds” can mean “busy,” not “dead.” Busy and dead need different handling.
Second, before a change, ask how many failure domains the configuration affects. The recent network configuration change has a time correlation with the failure, and Microsoft has been rolling it back. The change review form should include a field: which shared dependencies does this change involve? If the answer is “all replicas read this configuration,” treat it as a global change, not a routine push.
Third, put a capacity dashboard next to the rollback button. A rollback redistributes traffic. If the remaining nodes lack headroom at that moment, the rollback can trigger a second overload. A rollback is a new traffic event.
6. November 14
The MO1550821 page turned from red to gray and was archived. The same user opened Outlook in the morning, and email popped up normally. He cursed, “What the hell was yesterday,” and clicked Mark All as Read. He did not open the incident report. He did not search for what “cascading failure” meant.
On the health-check dashboard, the green curve climbed back. The threshold was still three seconds. At the next configuration change review, someone asked one more question: “How many failure domains does this change affect?”
No one answered “beyond embarrassing.” That phrase stayed in the November 12 feed and sank with the archived incident report.
About the Creator
Jin
Writer of reamstories
https://reamstories.com/jin
Enjoyed the story? Support the Creator.
Subscribe for free to receive all their stories in your feed. You could also become a paid subscriber, letting them know you appreciate their work.
Comments
There are no comments for this story
Be the first to respond and start the conversation.