
Financial Analytics Software Development: Building Systems People Can Actually Trust
See how modern financial analytics systems turn raw data into dashboards, reports, and real-time insights.
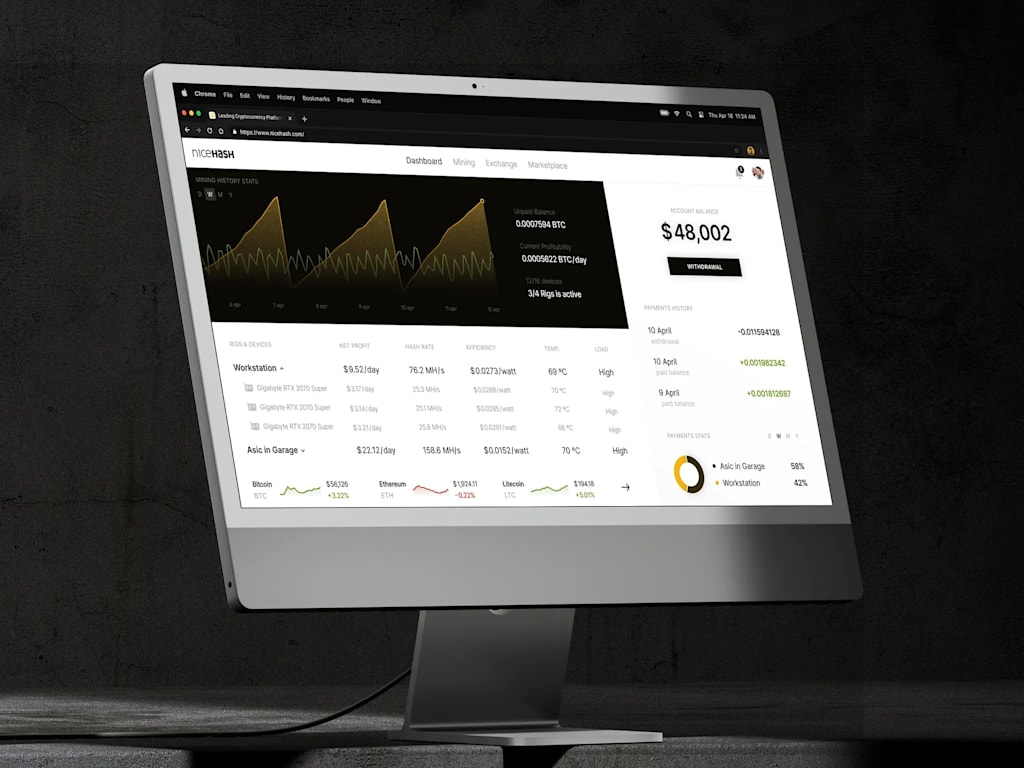
Most financial analytics projects do not begin with a grand platform strategy. They begin with a spreadsheet, a dashboard somebody hacked together, and a growing suspicion that none of the numbers quite match.
That is the predictable moment when analytics stops being a reporting task and becomes a product problem. In many SaaS environments, the real challenge is not drawing charts. It is building a system that can collect inconsistent data from multiple sources, process it reliably, and present it in a way that finance, product, and risk teams all trust.
The Real Job Is Not the Dashboard
When people talk about financial analytics software, they often picture the visible layer: charts, tables, KPIs, filters. That is the part users touch, so naturally it gets the attention.
But dashboards are the easy part.
The hard part is everything underneath. Payment providers send data in different formats. Internal ledgers evolve over time. Accounting systems use one logic, operations teams use another, and none of them were designed with clean analytics in mind. If that foundation is messy, the interface becomes a very polished way to display conflicting numbers.
That is why good financial analytics systems are built backward. You start with data lineage, validation rules, and transformation logic. Only then does it make sense to design the screens.
What a Financial Analytics Platform Actually Does
A useful platform usually has four jobs.
First, it collects data from external and internal systems: transactions, balances, settlements, fees, account activity, sometimes trading or lending events.
Second, it normalizes that data. Timestamps, currencies, statuses, and naming conventions have to be brought into one consistent structure. Without that step, every report becomes an argument.
Third, it calculates something meaningful. Revenue trends, failed transaction rates, exposure, margin changes, cash flow projections, unusual activity. Raw data is rarely the thing decision-makers need.
Fourth, it makes those outputs accessible. Not beautiful for the sake of beauty, but readable under pressure. Financial teams do not open dashboards to admire them. They open them to answer a question quickly.
Why These Systems Get Harder Over Time
The first version is usually manageable. A few integrations, some historical data, several essential reports. Then the business grows.
A new payment provider is added. A second market appears. Compliance asks for traceability. Leadership wants live metrics instead of daily summaries. Suddenly the platform is no longer a reporting layer. It is operational infrastructure.
That shift changes the engineering problem completely.
Batch jobs that worked fine at low volume begin to miss schedules. Queries that once felt instant start dragging under historical load. Edge cases multiply. The complexity comes not from any one feature, but from the accumulation of perfectly reasonable business requests.
This is why financial analytics software development is less about building one clever system and more about building a structure that can survive change.
What Good Teams Build Differently
Strong teams expect growth early.
They separate transactional systems from analytical storage. They treat pipelines as products, not glue code. They validate data before it reaches executive dashboards. They assume integrations will break, formats will change, and reporting logic will get more specific over time.
Just as importantly, they resist the urge to overdesign the interface too soon. In analytics products, clarity wins. A restrained dashboard with fast filtering and dependable numbers is worth far more than an impressive interface sitting on top of fragile logic.
That pattern shows up again and again in finance products. Whether the system is built around trading activity, research output, payment behavior, or internal reporting, the same rule applies: if users doubt the data, the platform fails.
The Part Companies Usually Underestimate
Most teams underestimate maintenance.
They budget for launch and forget that analytics platforms live in moving environments. APIs change. Data definitions shift. Compliance requirements expand. New teams want access. Historical datasets get heavier every quarter.
So the real value of an experienced development partner is not only shipping version one. It is knowing which decisions will still hold up a year later. That usually comes from building similar systems before, especially in products where reporting, operational visibility, and scale all matter at once.
If the goal is to build a financial analytics product that stays reliable as the business grows, it helps to work with a team that understands both the interface layer and the infrastructure beneath it. That is exactly where disciplined web development services start to matter—not as a generic offering, but as the engineering foundation for software people will depend on every day.
About the Creator
Enjoyed the story? Support the Creator.
Subscribe for free to receive all their stories in your feed.
Comments
There are no comments for this story
Be the first to respond and start the conversation.