
Data Analytics for eLearning Platforms
Find out how data analytics helps eLearning platforms track learner behavior, improve outcomes, and grow with clearer product decisions.


Many eLearning organizations mistakenly attribute their challenges to content quality, user experience design, or learner retention strategies. In reality, the root cause is frequently a lack of proper data infrastructure.
When students abandon courses midway, bypass assignments, neglect assessments, or vanish after registration, the platform is actively signaling where the friction lies. The problem is that without robust analytics, these critical indicators remain hidden within unprocessed event logs, siloed dashboards, and disjointed reports. What appears to be poor engagement is often simply a product team operating without visibility.
Consequently, data analytics has become integral to contemporary EdTech development. Organizations are investing in learning analytics not merely to aggregate statistics but to gain deep insights into learning behaviors, identify pain points, determine engagement drivers, and validate which modifications truly enhance results. In today’s competitive landscape, this level of insight is essential rather than optional, directly influencing retention rates, completion metrics, strategic product choices, and sustainable growth.
Constructing such a system requires more than just embedding charts into an administrative interface. An effective analytics framework must accurately capture relevant learner interactions, organize data logically, and translate it into actionable intelligence for product, content, and business stakeholders. This is why seasoned eLearning providers treat analytics as a foundational element of their platform architecture. Given the need for scalable logic, dependable reporting, and iterative improvement, these systems often benefit from the rigorous product methodologies typical of mature SaaS companies.
This guide explores the mechanics of analytics within eLearning environments, highlighting key features, architectural considerations, supporting technologies, and common hurdles in transforming educational data into a competitive edge. We will also examine how analytics fuels the emergence of AI-powered learning tools and why pristine, well-structured data is becoming a paramount asset in the EdTech sector.
Defining Data Analytics in eLearning
At its core, education data analytics is about uncovering the truth of what occurs within the platform.
It is not about the curriculum designers’ intentions or the idealized user funnel. It is about observing actual learner behavior.
Users may register and vanish after the second module. They might replay a specific video multiple times. They could ace quizzes rapidly yet never complete the course. Some may linger extensively in one section while rushing through another. Every action leaves a digital footprint. Analytics serves to gather these footprints and interpret their meaning.
This is the primary function of education data analytics: it enables teams to monitor platform usage, track navigation through learning paths, and pinpoint where the experience breaks down. Ultimately, this practice is not about accumulating figures for their own sake; it is about enhancing educational outcomes using evidence rather than intuition.
Typically, these systems analyze three distinct dimensions simultaneously:
- User Behavior: This encompasses raw interactions within the product, such as logins, clicks, session duration, video playback, lesson navigation, downloads, pauses, replays, and exits. Behavioral data reveals how learners engage with the platform as a software product.
- Learning Progress: This focus is more specific, tracking completed modules, quiz attempts, assessment results, time invested in lessons, pace of progression, and overall course completion. This metric indicates whether users are genuinely absorbing material or merely skimming it.
- Engagement Metrics: These indicators help teams gauge sustained involvement over time. Do users return after their initial session? Do they persist beyond the first week? At what stage does attrition begin? This is often where underlying product flaws first become apparent.
In practical application, learning analytics generally categorizes them into three types:
- Descriptive Analytics: This illustrates past events, providing a baseline overview. It answers questions like: How many enrollments occurred? How many completions were recorded? Where did users spend the most time? Where did they drop off? Which assessments had the lowest performance? This forms the foundation of most analytics systems.
- Diagnostic Analytics: This seeks to explain the causes behind the data. If learners consistently exit after a particular lesson, there is likely a specific reason. The content might be too complex, the structure confusing, or an assignment prematurely placed. This approach is valuable because it helps teams identify the source of the issue, not just the symptom.
- Predictive Analytics: This looks forward, leveraging existing patterns to forecast future outcomes. For instance, it can flag learners at risk of disengagement, falling behind, or dropping out before finishing. This layer is crucial for predictive learning systems, allowing the platform to proactively respond to learner data rather than simply reporting on it.
Technically, the infrastructure is straightforward. Data pipelines ingest events from the platform and transfer them into the system. A data warehouse stores this information in an organized format. Finally, an analytics engine processes the data, converting raw activity into meaningful metrics and patterns.
Simply put, data analytics allows an EdTech product to see its users with clarity. Without it, teams rely on guesswork. With it, they can detect issues early, diagnose necessary fixes, and make informed product decisions.
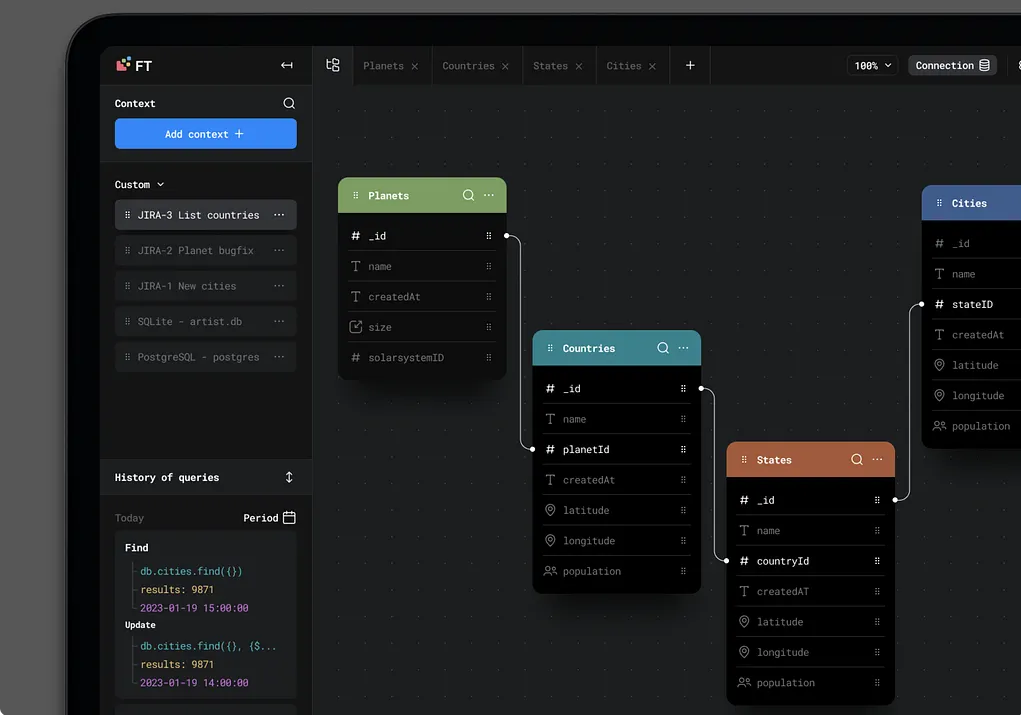
Essential Capabilities of eLearning Analytics Systems
While many analytical tools appear beneficial in theory, only a select few genuinely empower teams to diagnose product issues and prioritize improvements. In the context of eLearning, the most valuable features are often the most straightforward. The primary goal is visibility: understanding learner navigation, session duration, interaction patterns, performance outcomes, and pinpointing exactly where the educational journey falters. If a platform cannot provide this clarity, additional complex analytics offer little practical value.
1. User Behavior Tracking
This component reveals the reality of how learners interact with the platform, distinct from how designers intended them to use it.
Some users progress linearly through lessons; others open a course, linger briefly, and never return. Some consume all video content but bypass assessments, while others become trapped in specific sections, repeating actions without advancing. Behavior tracking exposes these distinct patterns.
- Course Progression: This is typically the first metric examined. It highlights starting points, completion rates, and drop-off zones. While seemingly basic, this data often reveals that issues are localized—perhaps confined to a single module, lesson, or confusing interface step—rather than affecting the entire course.
- Time on Task: Duration metrics are only meaningful when contextualized. Rapid progression may indicate skipping, whereas excessive time spent might suggest confusing material or poor structural clarity. Alone, time data is ambiguous; combined with progression and interaction logs, it becomes insightful.
- Micro-Interactions: These granular signals fill in the narrative gaps. Metrics such as video replays, quiz attempts, resource downloads, pauses, and exit points provide a deeper understanding of learner intent beyond simple completion status.
Through behavior tracking, teams often uncover hidden issues. A lesson may appear robust content-wise yet suffer from low engagement. A quiz might be frequently accessed but rarely completed. Heavy usage of supplemental resources often signals that learners require additional support at specific junctures.
2. Learning Performance Analytics
If behavior tracking illustrates what learners do, performance analytics evaluates how well they are learning.
This layer measures educational efficacy directly. By analyzing quiz scores, assessment results, failure rates, pass percentages, and milestone achievement, teams can answer a critical question: Is the course delivering its intended educational outcomes?
Activity levels can be deceptive. A user may spend significant time on the platform and access every lesson yet achieve poor results. Conversely, lower activity in certain sections may still correlate with strong mastery. Performance analytics distinguishes mere presence from genuine progress.
Furthermore, this analysis identifies knowledge gaps. When multiple learners struggle with identical topics, fail specific assessments, or require numerous retries, it flags a systemic issue. The cause might lie in content quality, sequencing, or unrealistic expectations. Regardless of the root cause, analytics provides concrete evidence for investigation. This is particularly vital for Learning Management Systems (LMS), which are expected not just to host content but to validate structured learning outcomes.
Effective eLearning platforms integrate both behavioral and performance data. Behavior shows the path taken; performance shows the result of that journey. One without the other offers an incomplete perspective.
3. Engagement and Retention Analysis
A course may appear healthy superficially while silently losing users throughout its duration.
Learners may register, engage with initial modules, and then gradually disengage. Frequency of visits drops, lessons remain unfinished, and assignments are skipped. Eventually, the user churns. Engagement analysis allows teams to detect this deceleration before it results in total abandonment.
This system monitors sustained involvement over time, tracking whether users return, continue learning, and advance. Key indicators include repeat sessions, weekly activity levels, incomplete modules, declining participation rates, and sudden pauses in progress.
Retention analysis approaches this from a predictive angle, identifying patterns that precede dropout. For instance, a learner who stops accessing lessons regularly, reduces session times, or abandons quizzes mid-attempt is exhibiting warning signs. While isolated events may be insignificant, consistent patterns indicate underlying problems.
This data is crucial for personalized learning systems. Platforms can leverage these signals to trigger proactive interventions, such as reminders, content adjustments, or support offers, preventing learner disappearance.
4. Real-Time Analytics
Some insights are valuable in retrospective monthly reports; others require immediate attention.
Real-time analytics provides live visibility into platform activity. It tracks current active users, their location within courses, unusual traffic spikes in specific lessons, sudden quiz failures, or engagement drops following updates. This capability shifts the focus from historical review to immediate situational awareness.
This feature is essential for platforms hosting live sessions, timed exams, large synchronous cohorts, or frequent content updates. If a technical issue arises or performance dips, waiting for delayed reports is ineffective. Teams need instant visibility to intervene while the issue is still manageable.
The core value here is velocity. Real-time analytics does not replace deep-dive analysis but provides immediate alerts when timing is critical.
5. Custom Dashboards and Reporting
Different stakeholders require different views.
- Instructors need to identify struggling students, pinpoint stuck learners, assess class performance on specific tasks, and locate bottlenecks in progress.
- Administrators focus on broader trends: overall completion rates, adoption metrics, group activity levels, usage trends, and platform-wide problem areas.
- Organizations require high-level reporting segmented by department, cohort, geography, or training program.
Consequently, customizable dashboards are essential. A static, one-size-fits-all chart set rarely suffices. Reports must be tailored to address the specific questions each stakeholder asks.
This is also where user experience design becomes critical. Even valuable data becomes unusable if the interface is cluttered, slow, or unintuitive. Effective dashboards require clear information architecture, logical filtering, and a robust frontend capable of handling complex data visualization without performance degradation. For dynamic, interactive reporting interfaces with role-based views, modern frameworks like React are often the preferred technical solution.
The ultimate goal of reporting is not merely to demonstrate data availability but to ensure data usability. Achieving this is challenging but fundamental to the success of any analytics strategy.

The Development Lifecycle of eLearning Analytics Platforms
Constructing a robust data analytics platform for eLearning requires starting long before the first dashboard is designed. Many teams mistakenly treat analytics as an afterthought, adding reporting features only after the core product is built. By then, critical architectural decisions may have already compromised data integrity. If the system fails to capture relevant events, defines vague metrics, or lacks a unified definition of success, even the most sophisticated visualization layer will yield limited value.
Therefore, a successful development process prioritizes strategy and interface design before moving into heavy technical implementation.
1. Strategic Planning and KPI Definition
The foundation of any analytics system is the clear definition of key performance indicators (KPIs). In eLearning, these might include course completion rates, lesson drop-off points, module dwell time, quiz scores, cohort retention, login frequency, progression velocity, or assessment outcomes. The specific metrics depend on the product type; a corporate training tool, a self-paced course provider, and an academic LMS will prioritize different data points.
Next, the team must map data sources and assess their completeness. Data originates from various touchpoints:
- Product Interactions: Lesson views, quiz submissions, logins, navigation paths, assignment uploads, and certificate issuances.
- External Systems: CRM records, payment gateways, content management systems, LMS modules, and communication tools.
Integrating these sources is critical, as fragmented data with inconsistent logic leads to analytical chaos.
Finally, the system must align with business objectives. Whether the goal is improving retention, demonstrating training ROI to clients, or identifying scalable courses, the platform’s design must reflect these priorities from day one. Without this alignment, teams risk tracking excessive data while gaining minimal insight. A well-defined strategy transforms analytics from a random collection of reports into a decision-support tool.
2. UX/UI Design for Analytical Interfaces
Once metrics are defined, the focus shifts to usability. How will stakeholders interpret and act on this information?
Even technically superior platforms fail if their interfaces are cluttered, confusing, or overloaded with irrelevant charts. Clarity supersedes visual complexity. Effective dashboard design prioritizes:
- Hierarchy: Determining what information appears immediately versus what requires deeper navigation.
- Relevance: Highlighting the most frequently used filters and meaningful comparisons.
- Role-Based Views: Recogn that instructors, administrators, and executives have distinct needs. Structures should support specific tasks rather than merely displaying available data.
Usability is paramount. Users should grasp insights instantly without extensive explanation. Charts must answer questions, not generate new ones. Trends, bottlenecks, and progress markers should be immediately visible. If the interface demands excessive cognitive effort, accurate data will remain unused.
At this stage, frontend technology choices also matter. Framework like React are ideal for building responsive, maintainable, and interactive dashboards, offering a superior experience compared to static reporting screens. The goal is to make analytics not just accessible, but intuitive and engaging.
3. Technology Stack Selection
The choice of technology depends on data volume, velocity, and the need for real-time insights.
- Backend Processing: Python is a standard choice for analytics-heavy applications due to its strong data processing libraries. It excels at metric calculation, event processing, and background tasks. Node.js is a viable alternative for API-centric systems or those requiring real-time capabilities. Some teams use FastAPI to bridge Python’s processing power with efficient API delivery.
- Data Streaming and Processing: For high-volume event streams, Apache Kafka helps manage learner activity, quiz submissions, and interactions without overwhelming downstream services. For heavy computational transformations on large datasets, Apache Spark becomes relevant.
- Storage: PostgreSQL is a reliable starting point for structured product data. However as analytical queries grow in complexity and volume, dedicated warehouses like BigQuery often provide better performance for large-scale analysis.
- Infrastructure: Docker ensures service portability, while Kubernetes supports scaling and management as the number of services and environments increases.
The objective is not to adopt the most impressive technologies, but to select tools that support the product’s needs without introducing unnecessary complexity. The right stack balances capability with maintainability.
4. Data Pipeline and Architecture
Reliability hinges on how data moves through the system. eLearning platforms generate diverse data streams—progress updates, video interactions, session logs, admin actions, and third-party integrations. Raw data arrives in fragments that rarely align naturally.
Robust pipelines, typically using ETL (Extract, Transform, Load) or ELT (Extract, Load, Transform) processes, are essential. The choice between them depends workflow preferences, metric volatility, and flexibility requirements.
Stability is more important than methodology. Inconsistent event capture undermines report trustworthiness. Fragile transformation logic turns minor reporting changes into major engineering tasks. Inadequate storage structures cause dashboard latency as data grows. These issues often arise sooner than expected, as even moderate traffic across multiple courses and cohorts generates significant data volume.
Architecture must be disciplined, not overengineered. There must be a clear, scalable flow from event collection to storage and analysis. This structure ensures that adding new KPIs or dashboards does not destabilize the system. In mature SaaS environments, analytics becomes integral to daily operations, influencing product, content, and operational decisions.
5. Analytics Engine Development
Data collection is only the beginning. The analytics engine transforms raw logs into actionable insights.
This layer calculates core metrics such as completion rates, drop-off points, quiz performance, and cohort retention. In simpler products, it feeds basic dashboards. In advanced systems, it performs complex operations: user segmentation, cross-course behavior comparison, bottleneck identification, and preparatory processing for predictive models.
The engine converts scattered activity into structured, readable intelligence. It evolves reporting from a static add-on into a core product feature. Teams must determine calculation frequencies, data freshness requirements, grouping logic, and access controls. This depth distinguishes true analytics platforms from basic reporting tools.
6. Testing and Data Validation
While less glamorous than visualization, validation is critical for credibility. Analytics can appear functional while containing underlying errors. Fast-loading charts with incorrect data are worse than no data at all.
Validation involves two stages:
- Input Verification: Ensuring events are captured correctly, without duplication or timestamp errors. Lesson views, quiz attempts, and sessions must align with system expectations.
- Output Verification: Confirming that reported metrics match reality. Completion rates, engagement drops, and other indicators must reflect actual user behavior, not tracking bugs. This requires cross-referencing reports with source data, testing edge cases, and ensuring consistency across user flows.
Trust is the currency of analytics. Once users doubt the accuracy of the numbers, the entire system loses value. Rigorous testing preserves this trust.
7. Deployment and Scaling
Launch marks the transition from controlled development to real-world operation. The system must now handle live traffic, unpredictable user behavior, and genuine reporting demands. Weaknesses in performance, pipeline latency, or dashboard responsiveness often surface only under load.
Post-launch adjustment is normal. Scaling presents the next challenge: more learners generate more events; more courses increase reporting complexity; more clients demand additional filters and historical data. Infrastructure that sufficed during development may quickly become constrained.
Deployment is not the end of development but the beginning of the system’s operational life. Continuous monitoring allows teams to tune performance, optimize architecture, and expand capacity. Ongoing support is vital, as analytics platforms are dynamic. New KPIs, evolving reporting needs, and additional data sources require the system to adapt without sacrificing stability.
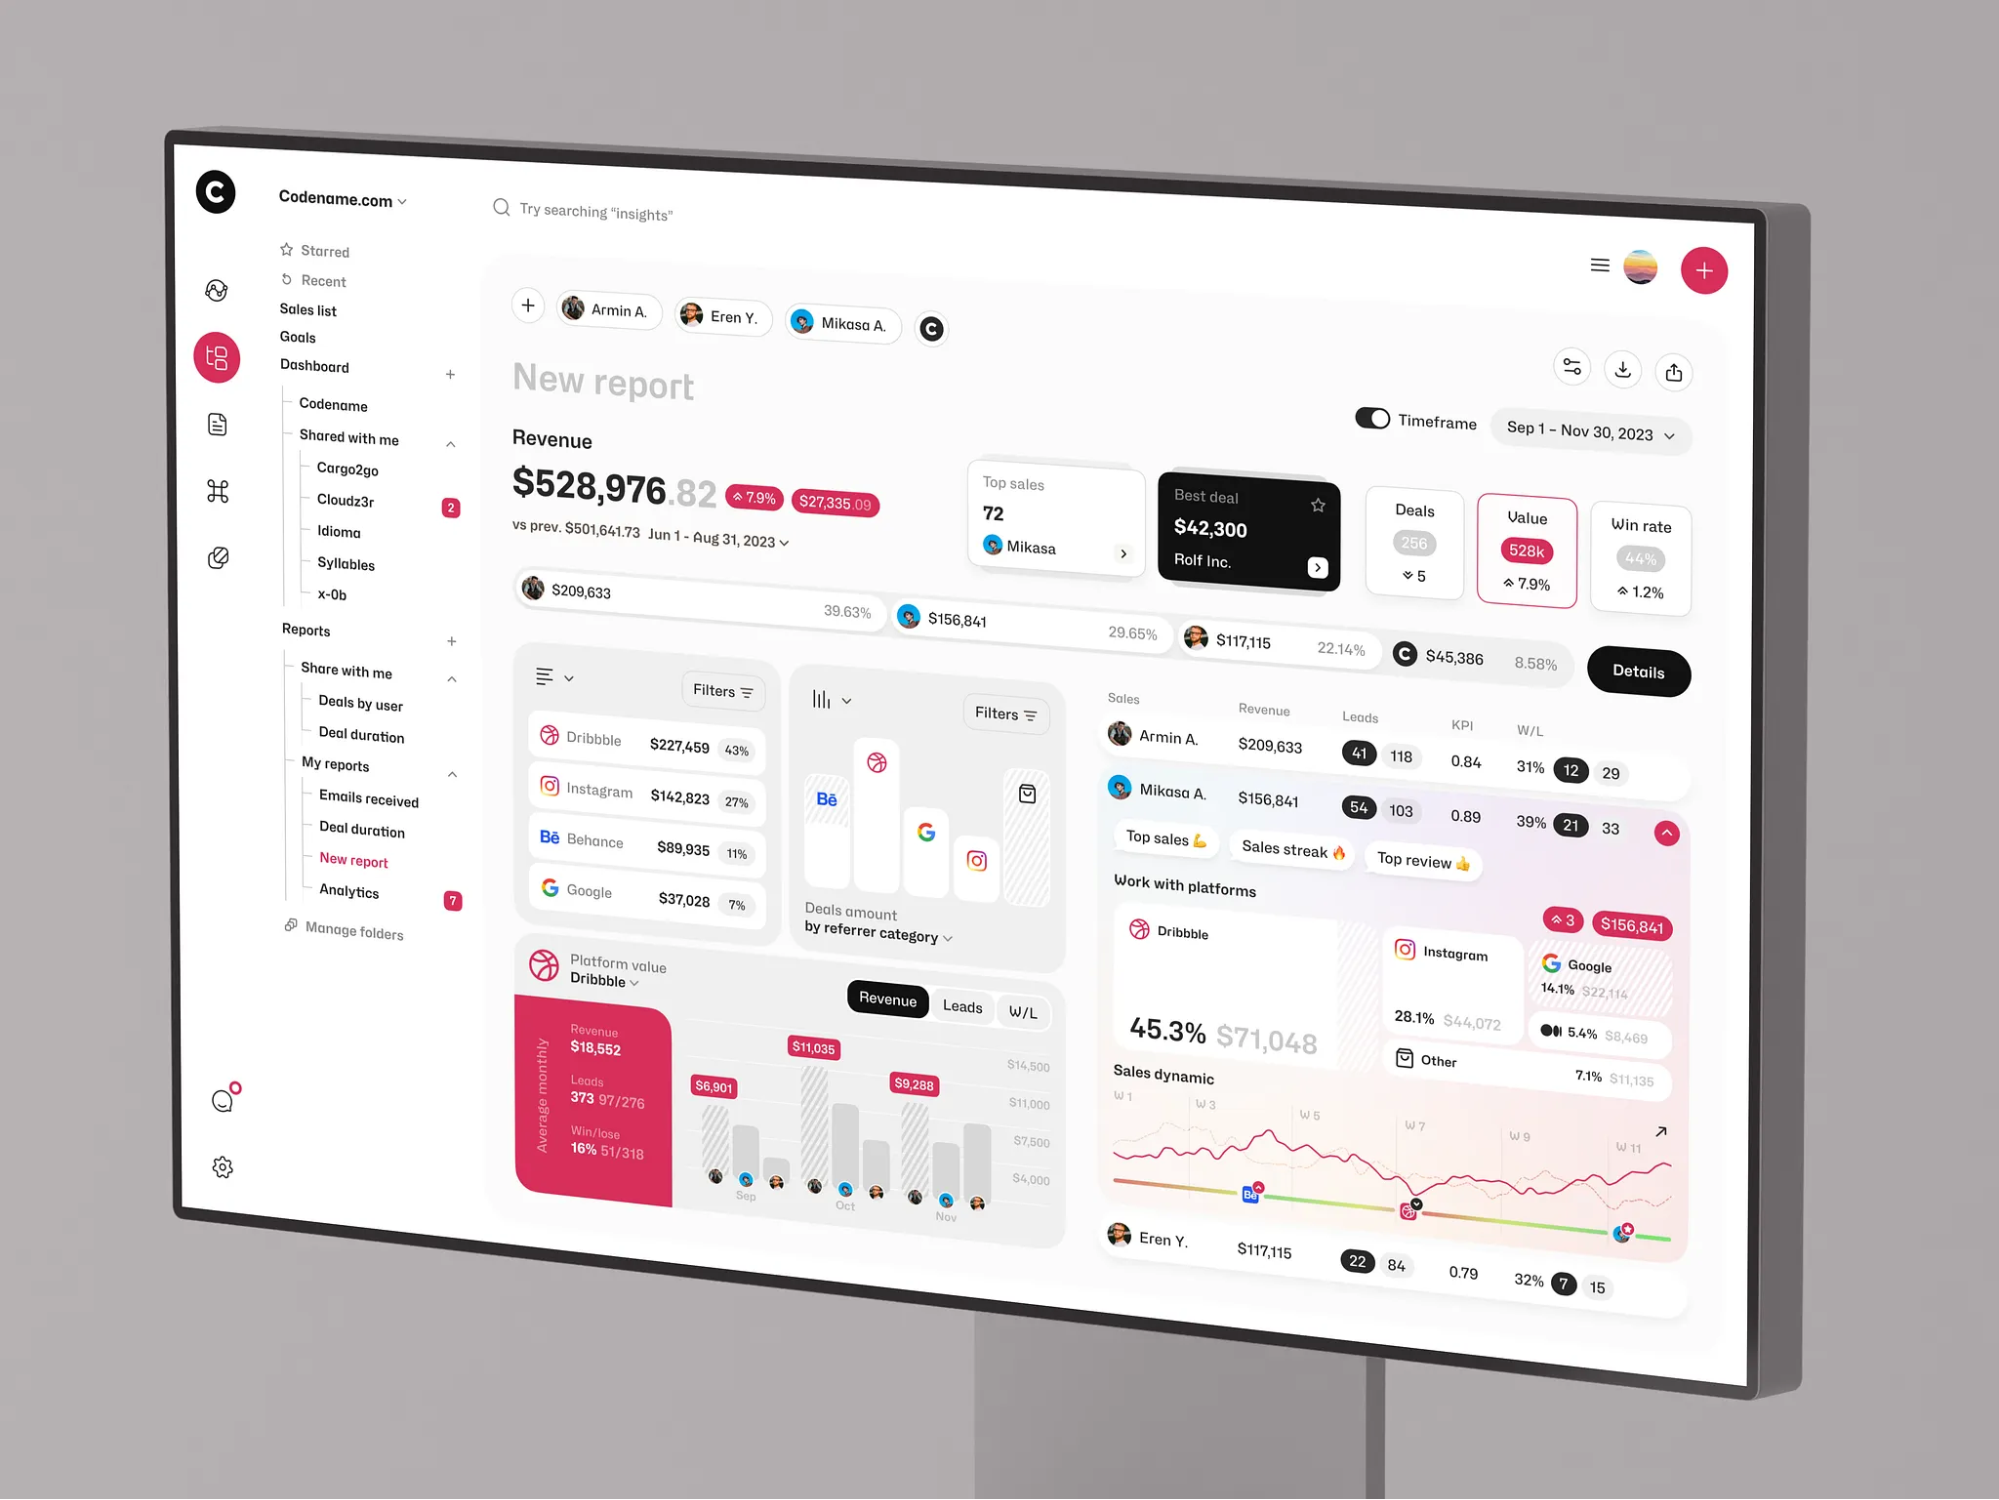
Navigating the Hurdles of eLearning Analytics Implementation
Conceptually, eLearning analytics appears simple: gather learner data, process it, and visualize actionable insights. However, the practical execution introduces significant complexity.
1. Managing Data Volume and Scalability
The sheer volume of generated data is often underestimated. Every lesson view, quiz attempt, video interaction, progress update, session log, notification, and repeated action contributes to a massive stream of events. Even platforms with a moderate user base can generate substantial daily data loads. If the underlying architecture lacks sufficient breadth, performance suffers: reports lag, dashboards become sluggish, and basic queries consume disproportionate resources. Scalability must be baked into the design from the start to prevent bottlenecks as usage grows.
2. Ensuring Data Integrity and Trust
Analytics is only valuable if stakeholders trust the figures. Maintaining this trust is difficult, as tracking inconsistencies are common in live environments. Events may fire multiple times, fail to register, or record completions prematurely. Time-based metrics can be skewed by session timeouts or connectivity issues. These minor tracking errors compound into significant reporting discrepancies. Once data accuracy is questioned, the credibility of the entire analytics system erodes, rendering it ineffective for decision-making.
3. The Complexity of Real-Time Processing
Many organizations demand live dashboards or near-instant insights, particularly for cohorts undergoing synchronized training or instructor-led sessions. Implementing real-time analytics significantly raises the technical barrier. Data pipelines must operate with low latency, processing systems must remain stable under high load, and user interfaces must stay responsive. While valuable for immediate intervention, real-time capabilities increase the complexity of both development and ongoing maintenance. This feature should be prioritized only when immediate visibility is critical to the product’s value proposition.
4. Privacy, Compliance, and Governance
eLearning platforms handle sensitive personal, performance, and behavioral data, making privacy a central concern rather than an afterthought. Analytics strategies must address:
- Data Minimization: Collecting only what is necessary.
- Purpose Limitation: Defining clear reasons for data collection.
- Access Control: Restricting visibility to authorized personnel.
- Retention Policies: Determining how long data is stored.
- Regulatory Alignment: Ensuring compliance with relevant laws (e.g., GDPR, FERPA, CCPA).
This is particularly critical in enterprise environments, where employee data and internal training records are subject to strict governance standards. Failure to adhere to these requirements can lead to legal risks and loss of user confidence.

The Strategic Value of Partnering with Data Analytics Specialists
As an eLearning product increasingly depends on reporting, learner insights, retention tracking, and performance analysis, the analytics system becomes deeply embedded in the product’s core. It influences architectural decisions, integration strategies, dashboard logic, data storage solutions, and cross-functional decision-making processes. Consequently, many organizations choose to collaborate with development teams that possess specific expertise in building data-intensive digital products, rather than relying on generalist web developers.
1. Scalable Data Architecture
A primary benefit of specialized partners is their ability to design for scale from the outset. While basic analytics setups may suffice initially, they often fail as the platform expands. Poor early decisions lead to slow queries, unreliable reports, and significant engineering overhead when adding new metrics. Experienced analytics developers anticipate these growth challenges, implementing robust architectures that prevent costly rework and performance bottlenecks down the line.
2. Domain Expertise in Analytics Systems
Collecting data is merely the first step; transforming it into actionable intelligence requires specialized knowledge. Data must be structured logically, processed consistently, and presented in ways that resonate with instructors, administrators, and business leaders. This goes beyond backend coding—it involves a deep understanding of metric definition, reporting logic, and user-centric design. Specialized teams ensure that outputs are not just technically accurate but genuinely useful for stakeholders.
3. Seamless Integration Complexities
eLearning platforms rarely operate in isolation. They integrate with Learning Management Systems (LMS), communication tools, internal admin systems, CRMs, content services, and other layers. An analytics system must function reliably across this complex ecosystem without becoming fragile. Partners with broad SaaS experience understand how to embed analytics into evolving platform environments, ensuring stability and coherence rather than treating analytics as an isolated add-on.
Final Thoughts
A robust eLearning analytics system does more than archive activity logs. It transforms raw data into comprehensible insights, providing clear direction for product development. This creates a virtuous cycle: data generates insight, insight drives optimization, and optimization fuels growth. This impact is tangible, influencing daily tasks such as course improvement, drop-off reduction, learner support enhancement, and strategic product decisions.
Success in this domain is not defined by the quantity of dashboards or data collected, but by the quality of the foundation. Data must be accurate, insights must be actionable, and infrastructure must be resilient enough to withstand growth. Therefore, analytics should be treated as a core component of the platform architecture, not an optional afterthought. When built correctly, it empowers companies to understand their product’s reality and improve it with confidence.
About the Creator
Shakuro
We are a web and mobile design and development agency. Making websites and apps, creating brand identities, and launching startups.
Enjoyed the story? Support the Creator.
Subscribe for free to receive all their stories in your feed.
Comments
There are no comments for this story
Be the first to respond and start the conversation.