


This is one piece of a three-part series that looks at the various methods, techniques, and best industry practices associated with data analysis.
Data comes in different forms from myriad sources. It can materialize as customer reviews, video ads, images, etc., or in a more traditional row and column format containing fields like CTR (Click Through Rate), bounce rate, etc.
There are many ways to analyze this data. Some of them are as follows:
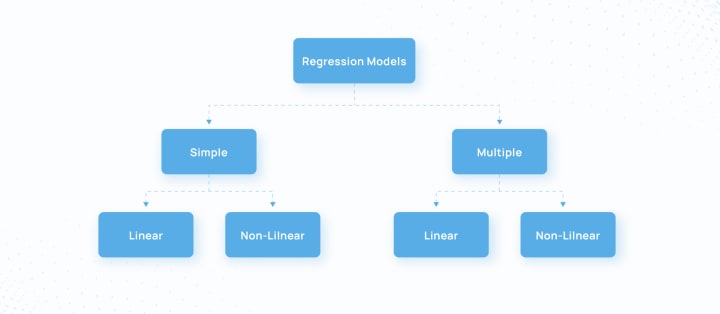
1. Regression analysis
- Regression analysis is used to find trends and patterns by analyzing the data.
- It seeks to spot a correlation between a dependent variable (the one you want to measure the impact on) and an independent variable (the one which may or may not impact the dependent variable).
- Example: Running a regression analysis on your ad spend (independent variable) and ROI (dependent variable) will help you determine a positive or negative relationship between the two variables.
- If there are a lot of variables you have to consider, there are more advanced forms of regression analysis techniques you can utilize.
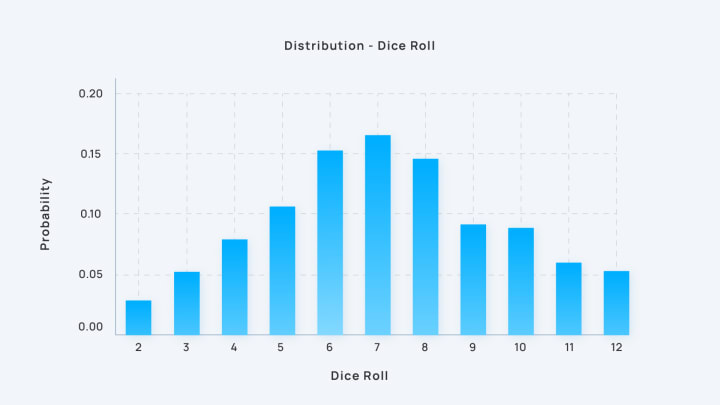
2. Monte Carlo Simulation
- Monte Carlo Simulation helps decision-makers deal with risks.
- It predicts all the outcomes of the steps you take, and the probability of them occurring, mathematically.
- One basic example of a Monte Carlo simulation is to calculate the probabilities of rolling two standard dice. They have 36 combinations in total. By utilizing Monte Carlo simulation you can simulate rolling the dice 10,000 times to foresee possible outcomes.
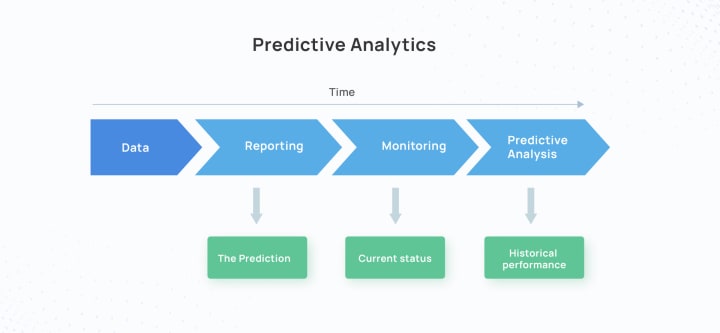
3. Predictive analysis
- Predictive analysis is the confluence of various data handling techniques like data mining, machine learning, statistical modeling, etc., to process historical data, and detect trends and patterns.
- Netflix has used this model to review the tendency of their audiences to prefer a certain kind of movie, documentary, or TV show, and churn out similar content.
4. Prescriptive analysis
- Prescriptive analysis strives to answer the big questions, such as “What ought to be done?” or “What is the next step?”
- It uses complex techniques in the fields of machine learning, neural networks, graph analysis, etc., to prescribe the best possible course of action.
- Google’s self-driving car Waymo is a good example of prescriptive analysis. By making millions of calculations during each ride, the car can intelligently slow down, take turns, and change lanes, all the while ensuring the safety of unbeknownst pedestrians.
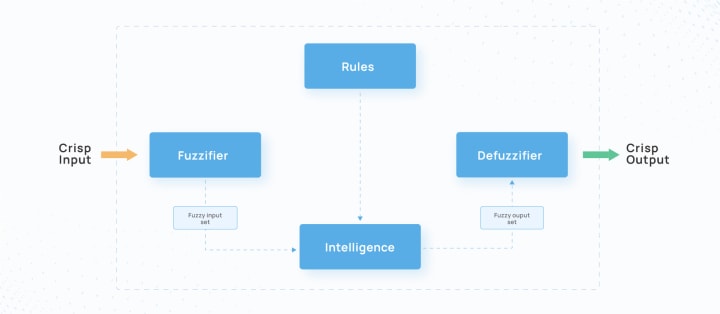
5. Fuzzy logic
- The Fuzzy logic approach to data analysis is based on degrees of truth rather than the usual true or false.
- It helps the machine arrive at a wide range of accurate results.
- Fuzzy logic has been used extensively in facial pattern recognition, Natural Language Processing (NLP), and complex applications of AI.
6. Factor analysis
- Factor analysis helps to streamline the data analysis process.
- It reduces a large number of observed variables into a small number of unobserved variables.
- While doing so, it unveils the previously unacknowledged latent variables.
- Example: The customer review of a product may contain variables like: Look & feel, comfort, frequency of use, price, features, and resell value.
- For a more effective evaluation of this data, you can group look & feel, comfort and frequency of use into a single latent variable called user experience.
7. Sentiment analysis
- Sentiment analysis uses Natural Language Processing (NLP) and machine learning techniques to mine texts, and discover the hidden emotions behind customer reviews.
- According to Oberlo, there are 192 million active users on Twitter alone, sending 500 million tweets every day.
- You can run sentiment analysis on data like this to gain a better understanding of your user base.
8. Cohort analysis
- Cohort analysis processes historical data to analyze customer behavior. When similar characteristics emerge, the data is segregated into several segments called 'cohorts'.
- It helps in understanding your target audience better.
- Example: In an email campaign, some of your content will resonate well with a particular target group, while others perform better with a different audience.
- You can classify your audience based on the content they most identified with into cohorts. Which gives you fodder for the next campaign.
In conclusion
These are some of the many data analysis techniques used by businesses to gain actionable insights. It is safe to say that we have only skimmed the surface of this vast topic.
In all the excitement about data analysis, one crucial matter is often overlooked — Where will the data come from? Who will get it?
From procuring data out of the most unconventional sources to ensuring its integrity through the best industry practices like data normalization, data cleansing, and other proven quality checks.
We do the leg-work, so you don't have to!
About the Creator
Grepsr
We are a team of tech-enthusiasts on a mission to ease the data needs of businesses around the world.
If you need clean and up-to-date data for your business, you need not look any further!
OnlyFans clone script download
Table of Contents What is an OnlyFans Clone Script? Best OnlyFans Clone Script Benefits of Using an OnlyFans Clone Script Key Features to Look for in an OnlyFans Clone Script Script OnlyFans: Customization and Flexibility Security Concerns with OnlyFans Clone Scripts How to Download and Install an OnlyFans Clone Script OnlyFans Clone App: Mobile Optimization Top 5 OnlyFans Clone Scripts on the Market Conclusion
By Beck Jenner2 days ago in 01
Bulk Disposable Tubing Market: Industry Analysis Trends and Forecast By 2029
This Bulk Disposable Tubing Market report has been prepared by considering several fragments of the present and upcoming market scenario. The market insights gained through this market research analysis report facilitates more clear understanding of the market landscape, issues that may interrupt in the future, and ways to position definite brand excellently. It consists of most-detailed market segmentation, thorough analysis of major market players, trends in consumer and supply chain dynamics, and insights about new geographical markets. The market insights covered in Magnet report simplifies managing marketing of goods and services effectively.
By Rahul Sharma3 days ago in 01
Trauma Carnival
I have unpopular opinions on one of my old favorites, The L Word. First is: Jenny is my favorite character. Second: The show was originally about Jenny, her trauma, her broken identity and the way her sexuality was explored as an awakening that brought up many memories of childhood abuse.
By Melissa Ingoldsby6 days ago in Art


Comments
There are no comments for this story
Be the first to respond and start the conversation.