
BI Dashboard Development
Discover the intricacies of creating a BI dashboard: steps, potential challenges, core components, approximate costs, etc.


Scaling businesses frequently encounter a familiar, albeit frustrating, bottleneck. While information is abundant, retrieving straightforward answers—such as current monthly performance—often becomes a sluggish ordeal involving multiple stakeholders, days of delay, and poorly named spreadsheet files.
This fragmentation is common across various sectors, from software-as-a-service and healthcare to financial technology and even provisional internal tools. Often, sales, finance, and product teams report conflicting figures. While each department’s data might be technically accurate in isolation, the lack of alignment creates a blurred overall perspective.
This is the precise moment when investing in business intelligence (BI) dashboards becomes logical. The value isn’t in following trends, but in centralizing data into an accessible format. Effective dashboards allow teams to quickly identify significant shifts, prioritize urgent issues, and, crucially, disregard irrelevant noise—a benefit that is often underestimated.
Initially, many organizations rely on off-the-shelf reporting solutions. These can suffice for a time, but limitations eventually emerge: unique key performance indicators, unintuitive user interfaces, disparate data sources, or the need for role-specific views. At this stage, bespoke BI dashboard development offers a more suitable solution.
This overview explores the essence of BI dashboards, their functionality, essential features, typical development workflows, and potential pitfalls. While these projects may appear deceptively simple from the outside—just a few graphs and filters—the complexity reveals itself once real-world data is integrated.
Defining the BI Dashboard
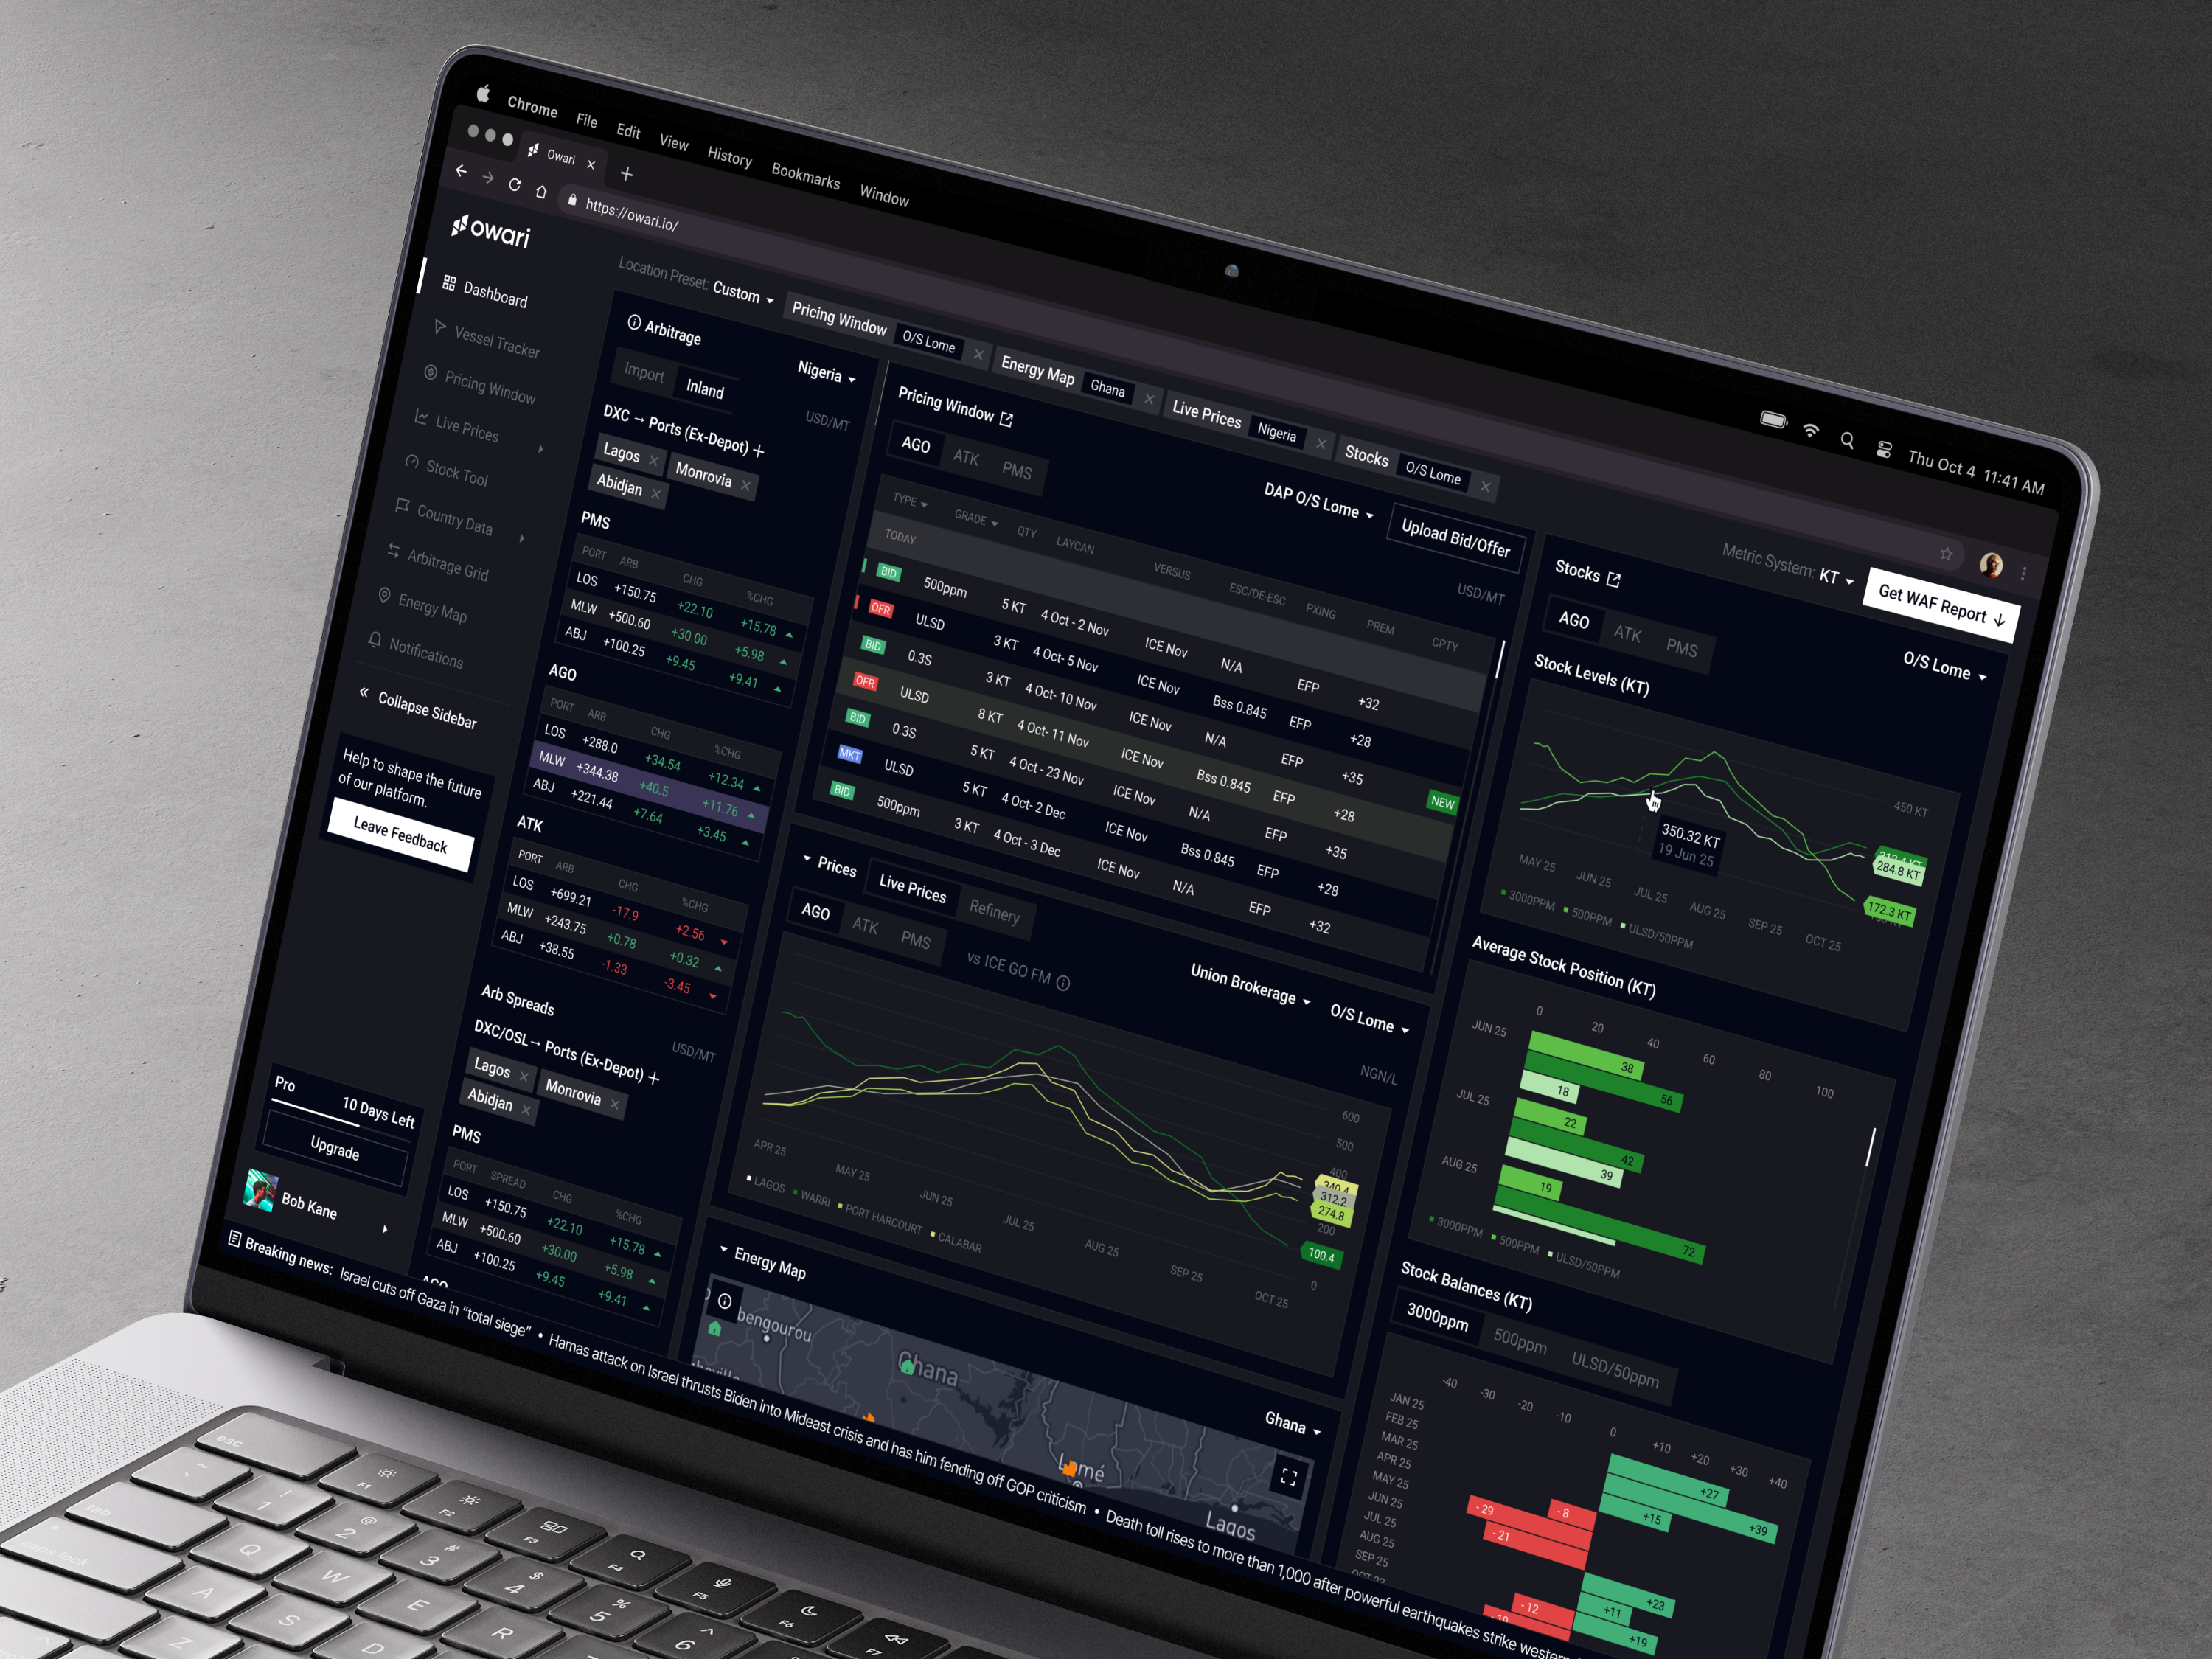
A BI dashboard serves as a visual interface, often comprising multiple screens, that consolidates business metrics into an actionable format. It operates within a larger intelligence ecosystem that includes data warehouses, APIs, processing pipelines, analytical logic, and access controls.
The primary objective is straightforward yet challenging to execute: enabling faster, higher-quality decision-making.
Consider different roles within the same organization. A founder might monitor revenue, churn, and acquisition metrics before investor meetings. A product manager could focus on user activation and feature usage. Meanwhile, a support lead might track ticket volumes and response times. Although they draw from the same data pool, their inquiries are distinct.
Consequently, developing effective BI dashboards extends beyond mere visualization. The interface must align with users’ mental models and workflows. If team members constantly need to interpret or explain the dashboard to one another, the design has likely failed.
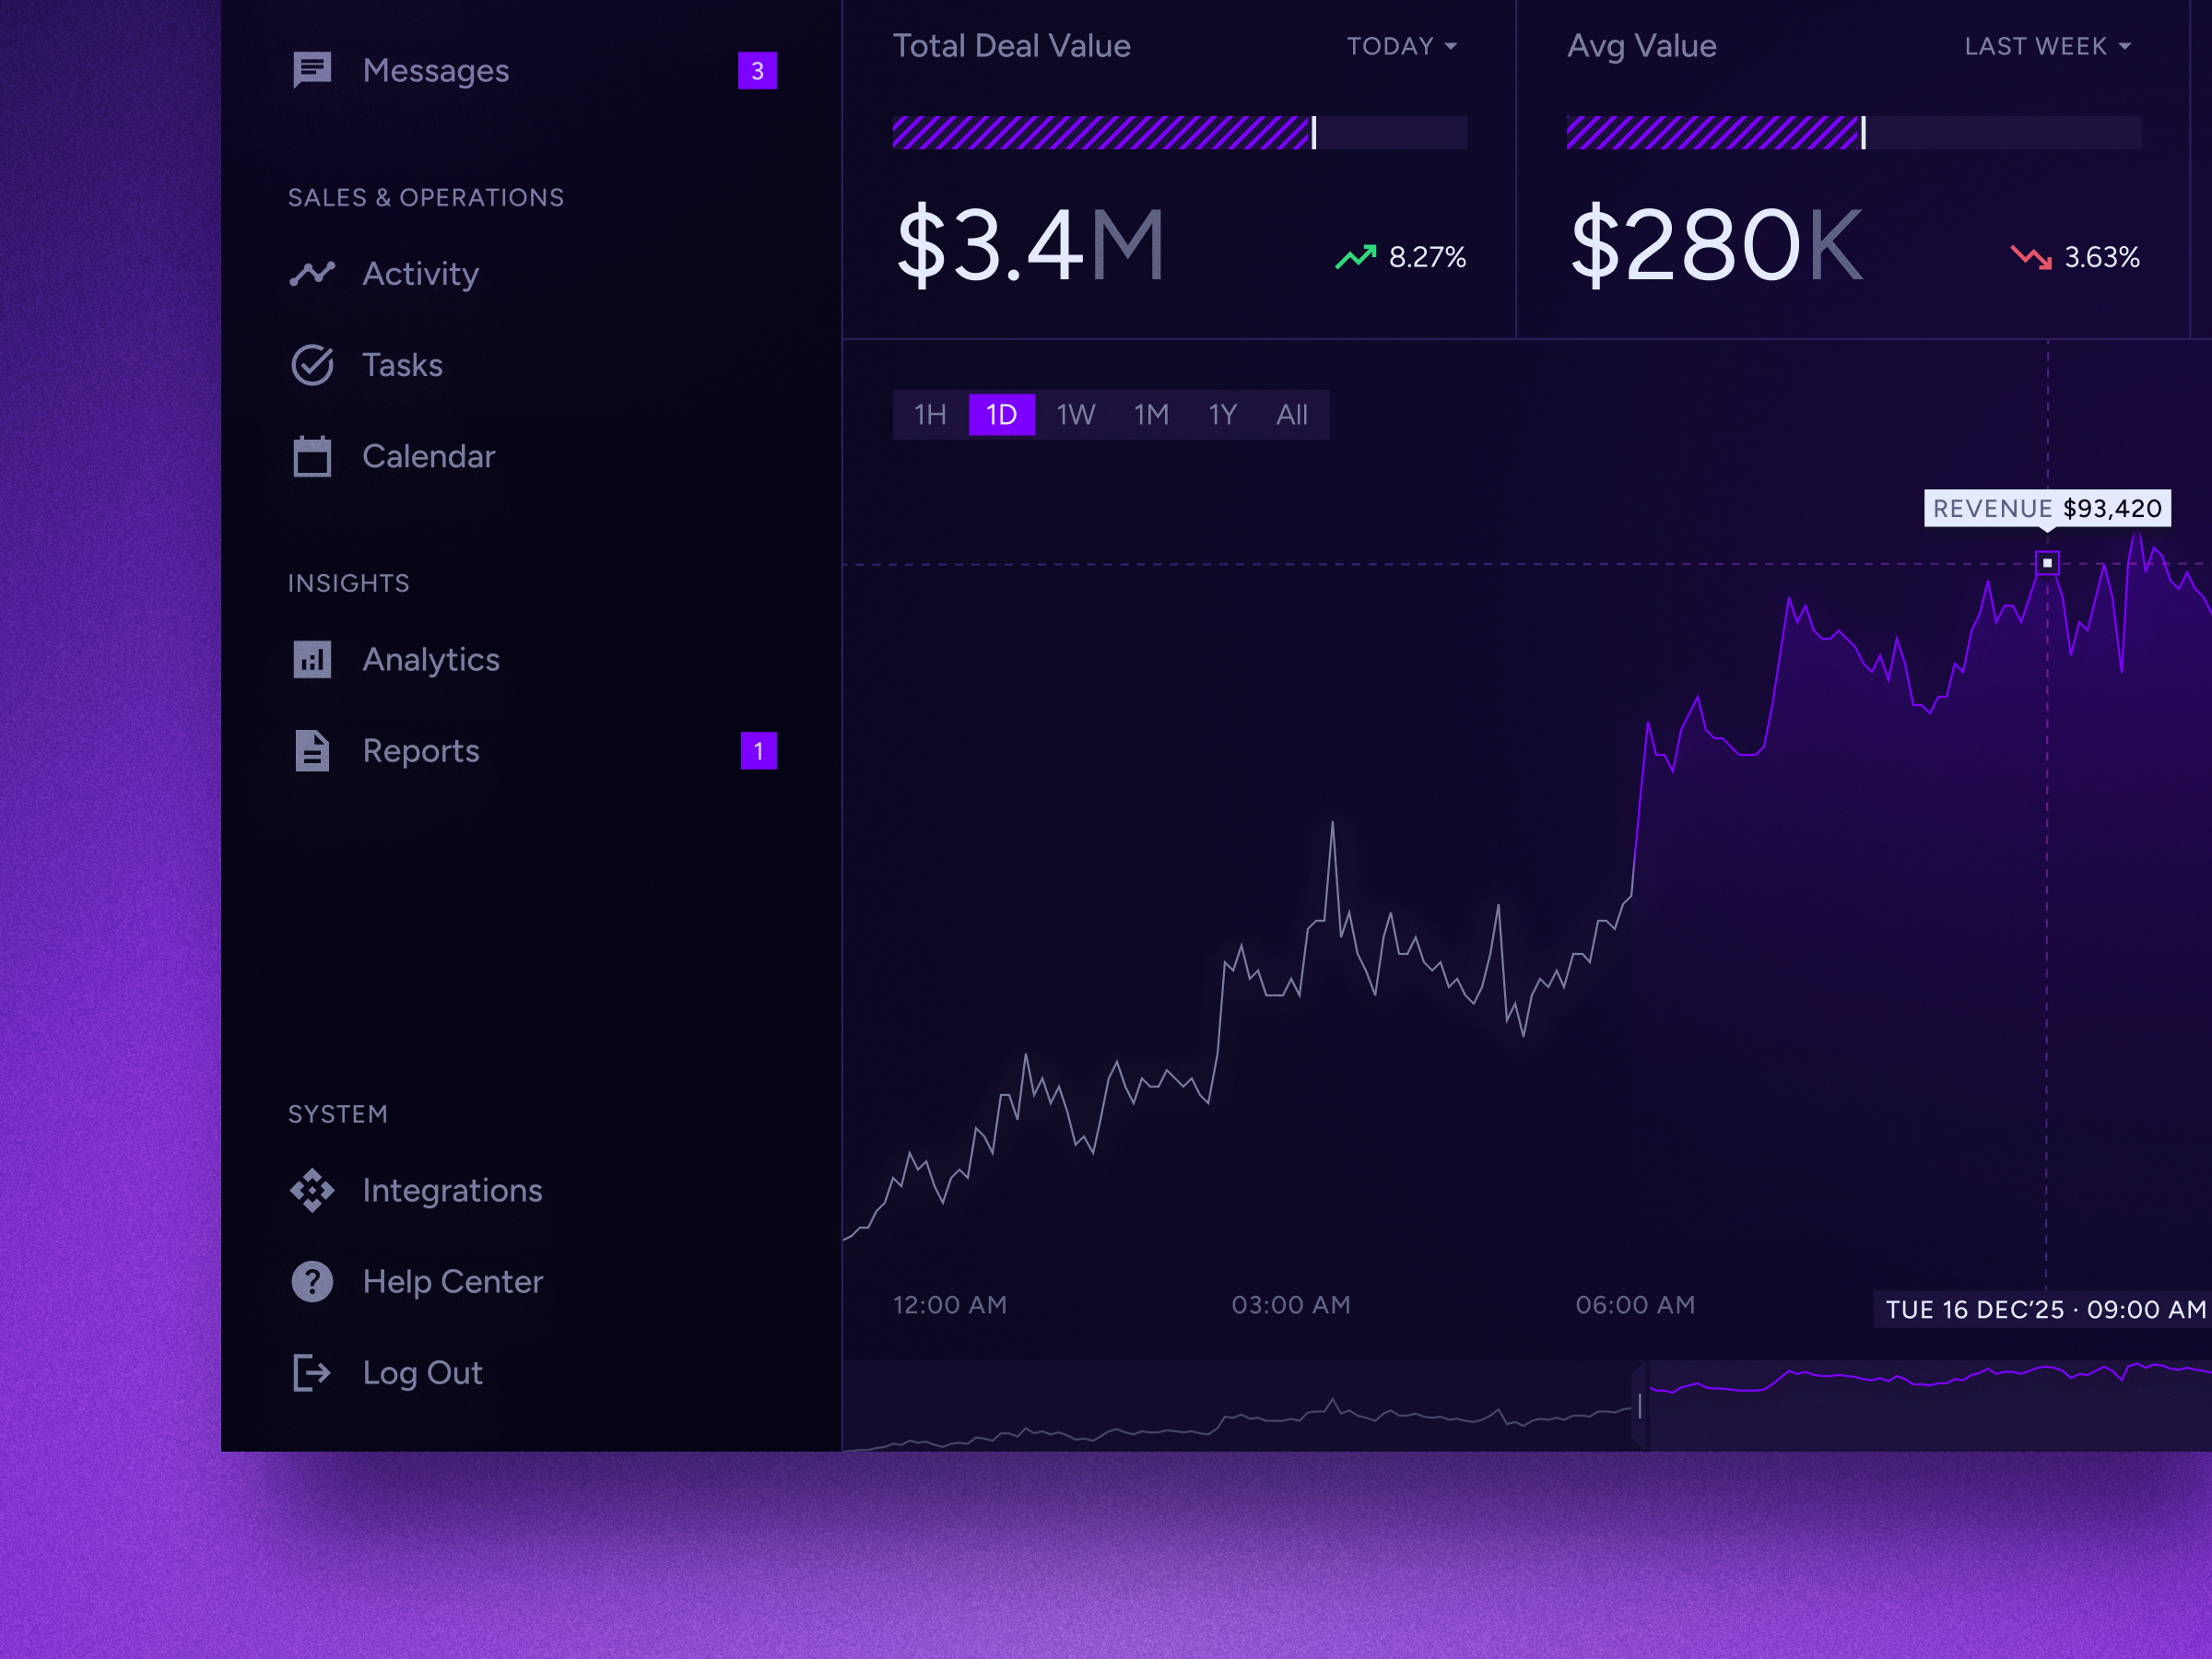
Categories of Business Intelligence Dashboards
Operational Dashboards
These tools are designed for real-time monitoring and daily execution. They provide immediate visibility into current activities, such as processing errors, logistics delays, support queue status, system outages, marketing expenditures, stock levels, or scheduled appointments. Because they track live operations, users typically consult these interfaces frequently, often multiple times throughout the day.
Strategic Dashboards
Focused on the bigger picture, these dashboards serve executives and department leaders who need to track long-term performance indicators. Metrics like overall revenue, customer retention rates, profit margins, sales pipelines, and growth trajectories are central here. Rather than triggering immediate reactive measures, these views help guide high-level organizational direction and strategy.
Analytical Dashboards
Built for deep exploration, these interfaces allow users to investigate the "why" behind the data. They enable detailed segmentation, filtering by geography or user cohorts, and trend analysis. While data analysts rely heavily on them, product teams also find them invaluable—provided the user experience is intuitive and does not hinder the investigative process.
Essential Architecture
Most BI systems are built upon four foundational layers:
- Data Sources: The raw input comes from a variety of systems, including Customer Relationship Management (CRM) and Enterprise Resource Planning (ERP) software, payment gateways, product analytics tools, marketing platforms, spreadsheets, direct databases, and external APIs.
- Data Processing Layer: This stage involves cleaning, merging, transforming, and structuring raw information for analysis. In robust implementations, this usually requires a centralized repository, such as a data warehouse, to ensure consistency and performance.
- Visualization Engine: This layer translates processed data into visual formats, including graphs, tables, heat maps, key performance indicator (KPI) cards, geographic maps, and other interface elements that enhance readability.
- User Interface (UI): The front-end experience encompasses layout design, interactive filters, navigation structures, access permissions, loading indicators, mobile responsiveness, and export capabilities. These subtle interaction details are often only noticed when they are poorly implemented or absent.
Security and Access Management
Permission controls are a critical component, particularly in enterprise environments where data sensitivity varies. Different stakeholders—such as regional managers, C-suite executives, finance teams, and external collaborators—require distinct levels of access. It is advisable to define these security protocols early in the development process rather than attempting to retrofit them just before deployment.
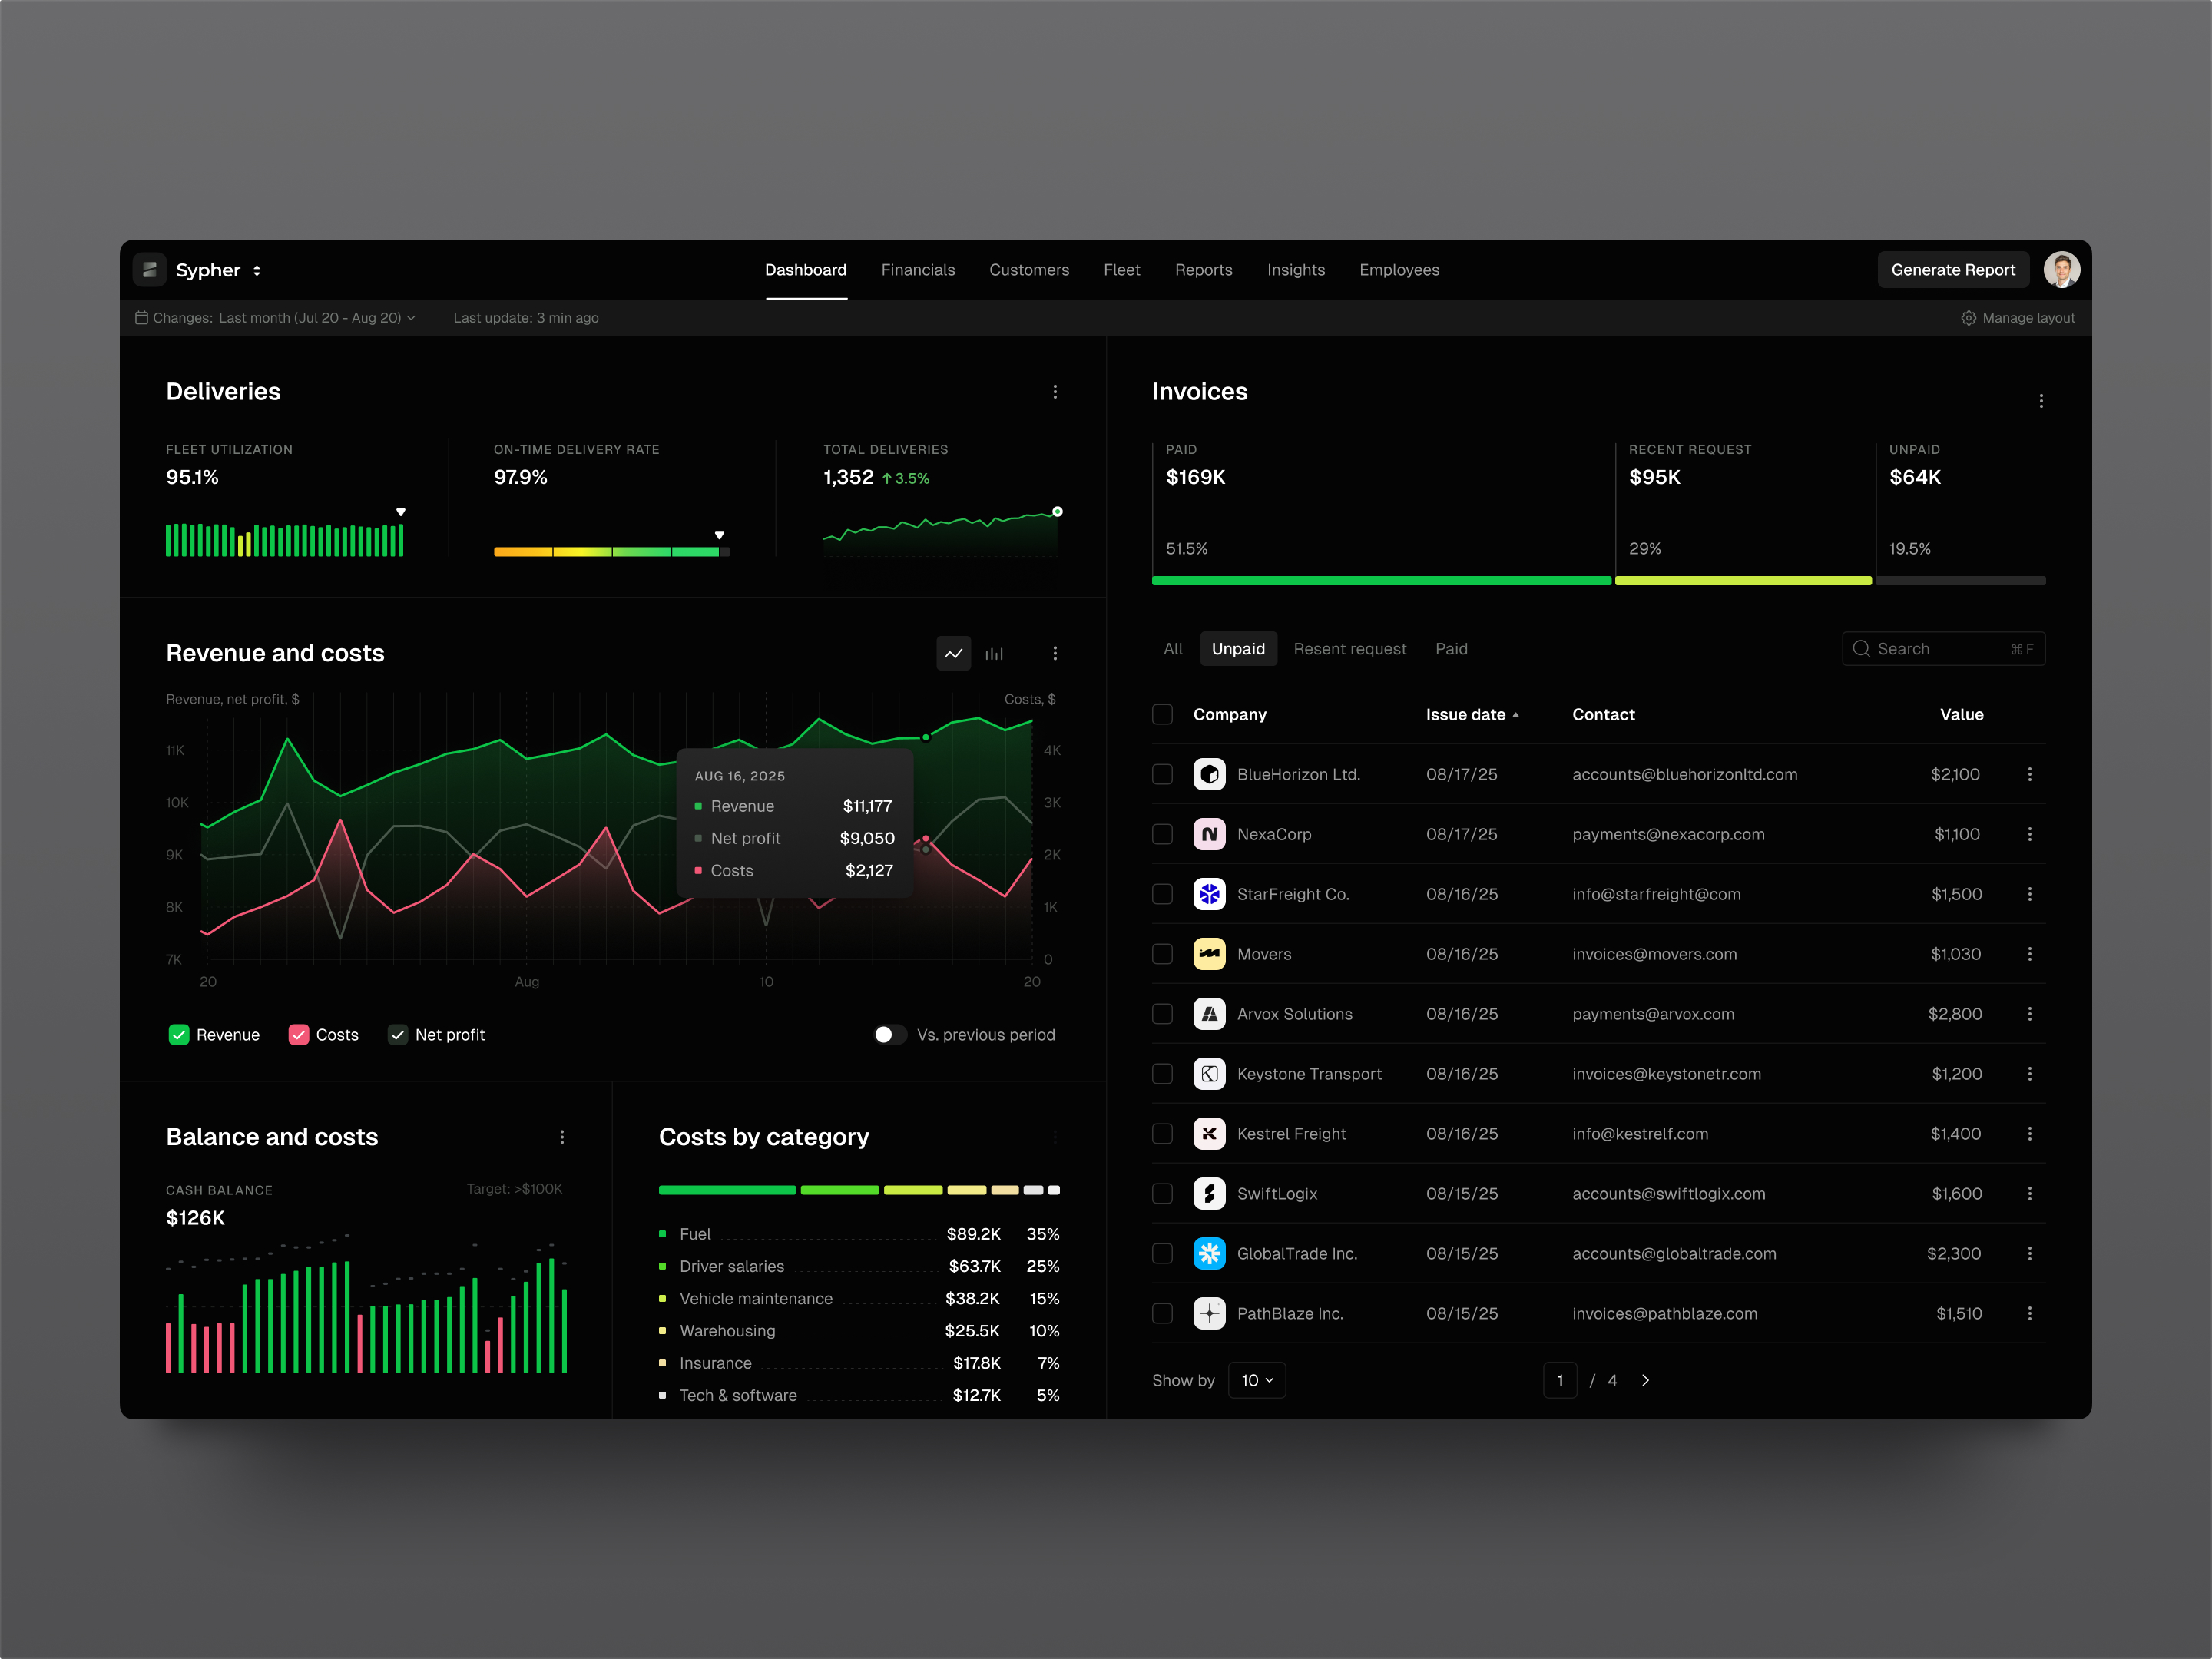
Essential Capabilities of BI Dashboards
Effective Data Visualization
While visual design is often viewed as the most engaging aspect of dashboard creation, it is also where confusion frequently arises. A graph can be mathematically accurate yet functionally useless if it suffers from cluttered palettes, ambiguous labeling, or inappropriate chart selection—such using a pie chart when a simple table would provide greater clarity. The ultimate failure is a visually striking display that fails to answer any substantive business questions.
Successful visualization begins with user intent: “What insight is this conveying?” Line graphs are ideal for tracking trends over time, bar charts facilitate direct comparisons, and tables remain superior for presenting precise figures. Heatmaps effectively highlight concentrations or outliers. Rather than relying on ornate decorations, effective design prioritizes clarity through logical hierarchy, legible text, adequate spacing, and intuitive grouping. This underscores the critical role of UI/UX principles in BI development.
Customization and Personalization
Different stakeholders interpret business performance through unique lenses. While a CFO, sales director, product manager, and customer success lead may all monitor revenue, their specific informational needs differ significantly.
Customizable dashboards empower users to tailor their experience by saving preferred layouts, rearranging widgets, selecting specific date ranges, or prioritizing key metrics. However, excessive flexibility can lead to interface complexity and decision fatigue. For growing organizations, role-based default views often strike the best balance. By providing optimized starting points for each job function while allowing minor personal adjustments, teams gain necessary flexibility without the burden of constructing their own interfaces from scratch.
KPI Monitoring and Context
Key Performance Indicators (KPIs) are the core justification for a dashboard’s existence. If these metrics are ill-defined, the tool becomes merely decorative.
An effective dashboard presents critical data with comprehensive context: current values, historical comparisons, targets, trend trajectories, and explanatory notes. For instance, if revenue declines, the dashboard should help identify whether the cause is increased churn reduced lead generation, or delayed billing cycles. While it may not provide every answer, it must guide users toward the root cause.
Furthermore, standardized metric definitions are vital for credibility. Terms like “active user” or “revenue” can have multiple interpretations within a single organization (e.g., booked vs. collected, gross vs. net). Establishing clear, consistent definitions is unglamorous but essential work that ensures the dashboard remains a trusted source of truth.
Interactive Filtering and Drill-Downs
Static reports suffice for quick status checks, but deeper analysis requires interactivity. Users often need to isolate specific segments, such as enterprise clients or regional performance.
Robust filtering and drill-down capabilities allow users to navigate from high-level summaries to granular details. Common filters include date ranges, product lines, geographic regions, traffic sources, account types, and user cohorts. Drill-down features might reveal underlying data tables, secondary charts, or dedicated detail pages.
The key is balance. Overloading widgets with excessive filters or hidden menus creates cognitive friction. The interface should encourage natural exploration rather than resembling a complex control panel that requires extensive training to operate.
Seamless Data Integration
The reliability of a dashboard is ultimately determined by the quality of its data pipeline. A polished frontend cannot compensate for latency, duplication, or inaccuracies in the underlying data.
Dashboards must integrate seamlessly with diverse sources, including databases, APIs, third-party SaaS tools, internal systems, and legacy spreadsheets. Consequently, dashboard development is closely tied to data engineering efforts. High-quality visualization actually exposes poor data quality more starkly; users will always prefer a simple, accurate table over a sophisticated but suspect chart. Trust is built on precision, not just aesthetics.
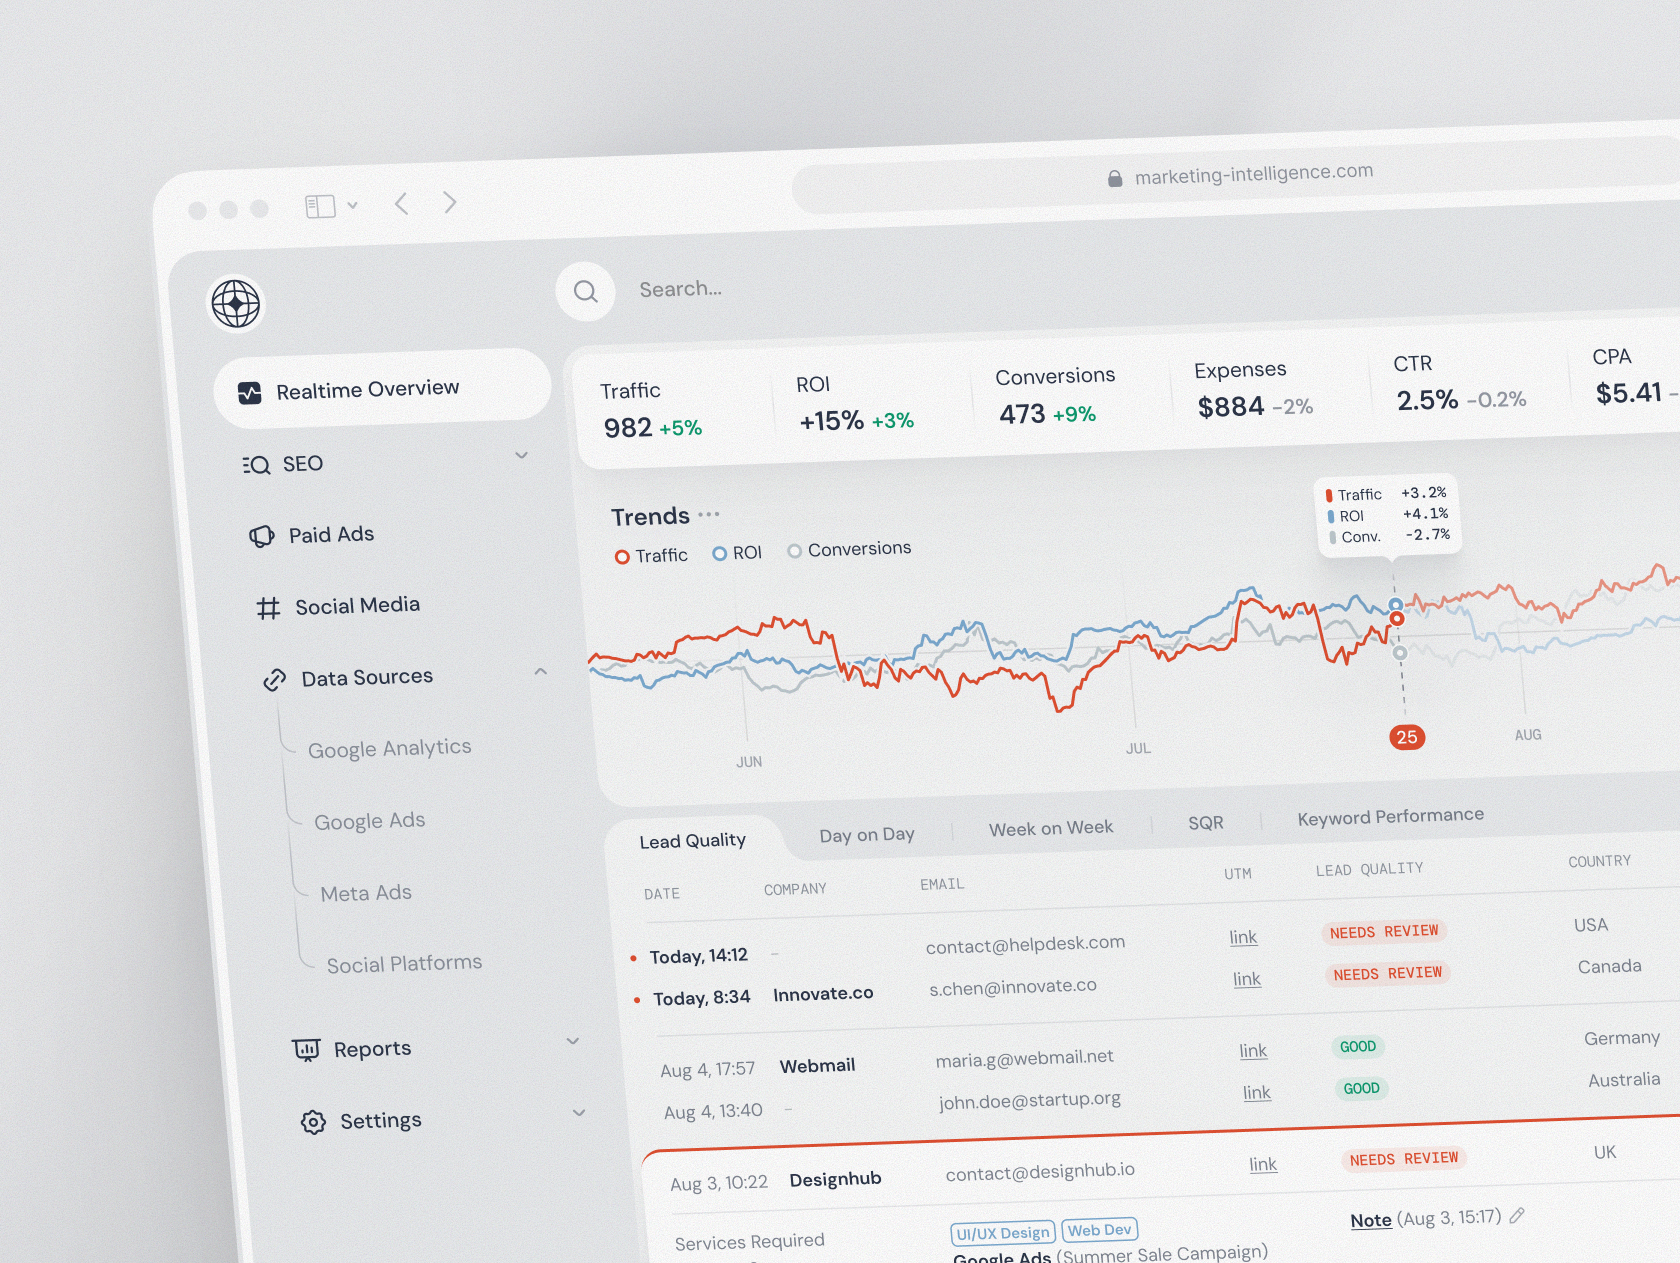
The Lifecycle of BI Dashboard Development
1. Defining Business Objectives and Metrics
Before writing a single line of code or selecting a technology stack, the development team must clarify the core business problems the dashboard aims to solve. Key questions include: Who is the primary audience? What specific decisions will this data inform? Which metrics are critical, and how frequently must they be refreshed? Additionally, what actions should be triggered by significant metric shifts?
This foundational phase typically involves stakeholder interviews, audits of existing reporting mechanisms, and the mapping of key performance indicators (KPIs) to user roles. Crucially, it is the ideal time to resolve semantic discrepancies. If departments like Marketing and Finance define terms like “revenue” or “active user” differently, these definitions must be standardized immediately. Failing to do so only amplifies existing organizational disagreements through the dashboard.
2. UX/UI Design Strategy
Effective dashboard design focuses on information hierarchy: determining what is prominent, what is secondary, and how to guide user interaction intuitively.
A well-designed interface prevents cognitive overload by highlighting primary signals upfront, grouping related data logically, and providing context without overwhelming the user with excessive detail. Designers typically begin with wireframes or interactive prototypes, allowing stakeholders to validate the structural layout before significant engineering resources are committed. Adjusting a KPI card in a prototype is far more efficient than refactoring a completed analytics module.
Furthermore, attention must be paid to non-data states. Empty states, loading indicators, and error messages are critical components of the user experience. In real-world scenarios, data loads may delay, filters may yield no results, and users require clear feedback on system status to maintain trust.
3. Selecting the Technology Stack
Technology choices should be driven by product requirements rather than personal preference.
For the frontend, frameworks like React and Vue are widely adopted. React, in particular, is favored for its component-based architecture, which facilitates the creation of reusable elements such as filter bars, data tables, and chart containers. This approach is especially beneficial if the dashboard is integrated into a larger web application.
On the backend, teams may utilize Node.js, Python (e.g., FastAPI), or other frameworks to manage API endpoints, authentication, and business logic. Data storage solutions vary by scale: PostgreSQL may suffice for smaller systems, while enterprise-level analytics often require dedicated data warehouses, optimized reporting tables, or specialized analytical databases.
Infrastructure considerations—such as containerization (Docker/Kubernetes), task scheduling, message queues, and cloud services—should align with the project’s scope. Over-engineering a simple internal tool with enterprise-grade infrastructure is a common pit that should be avoided.
4. Data Integration and Modeling
This phase involves the rigorous work of extracting, cleaning, transforming, and loading (ETL) data from disparate sources. Challenges often include inconsistent field naming, mismatched identifiers (e.g., Customer IDs), timezone discrepancies, missing records, and duplicates. While tedious, resolving these issues is essential for data integrity.
For dashboards relying on substantial data volumes, proper data modeling is critical. Operational databases are optimized for transactional speed, not analytical queries. Therefore, developers often create aggregated views, materialized tables, or warehouse models to enhance query performance and stability. Rushing this layer leads to slow load times and inconsistent figures, eroding user confidence in the platform.
5. Developing the Visualization Layer
With clean data in place, developers construct the visual interface, including charts, tables, widgets, interactive filters, legends, and export functionalities.
Implementation often reveals edge cases that designs overlook: long category labels truncating text, sparse datasets appearing empty, or dense datasets causing browser performance issues. Color schemes that look appealing in design tools may fail accessibility contrast standards. Additionally, stakeholders frequently request features like Excel exports, reflecting the enduring reliance on spreadsheets for deeper analysis.
Successful visualization development requires meticulous attention to detail. Engineers must optimize rendering performance, ensure accessibility compliance, handle error states gracefully, and verify responsive behavior across devices.
6. Testing and Validation
Quality assurance for dashboards extends beyond functional testing of buttons and layouts; it requires rigorous data validation.
Teams must verify filter logic, permission levels, responsive design, cross-browser compatibility, and export functionality. More importantly, KPIs must be cross-referenced against trusted source systems. Discrepancies between the dashboard and established financial reports are quickly noticed by users and can severely damage credibility.
Testing should utilize realistic, messy data rather than idealized samples. Real-world data includes irregular formatting, null values, unexpected categories, and historical anomalies that the system must handle robustly.
7. Deployment and Ongoing Maintenance
Launch marks the beginning, not the end, of the dashboard’s lifecycle.
Business environments are dynamic: APIs evolve, product events are renamed, and new filtering requirements emerge. Metric definitions may need refinement, such as excluding test accounts from “monthly active users.”
Sustainable maintenance involves continuous monitoring, bug resolution, performance optimization, security patching, and data quality checks. For mission-critical dashboards, support protocols should be established from the outset. A tool that drives daily decision-making cannot be treated as a static, one-time deliverable; it requires ongoing care to remain relevant and reliable.
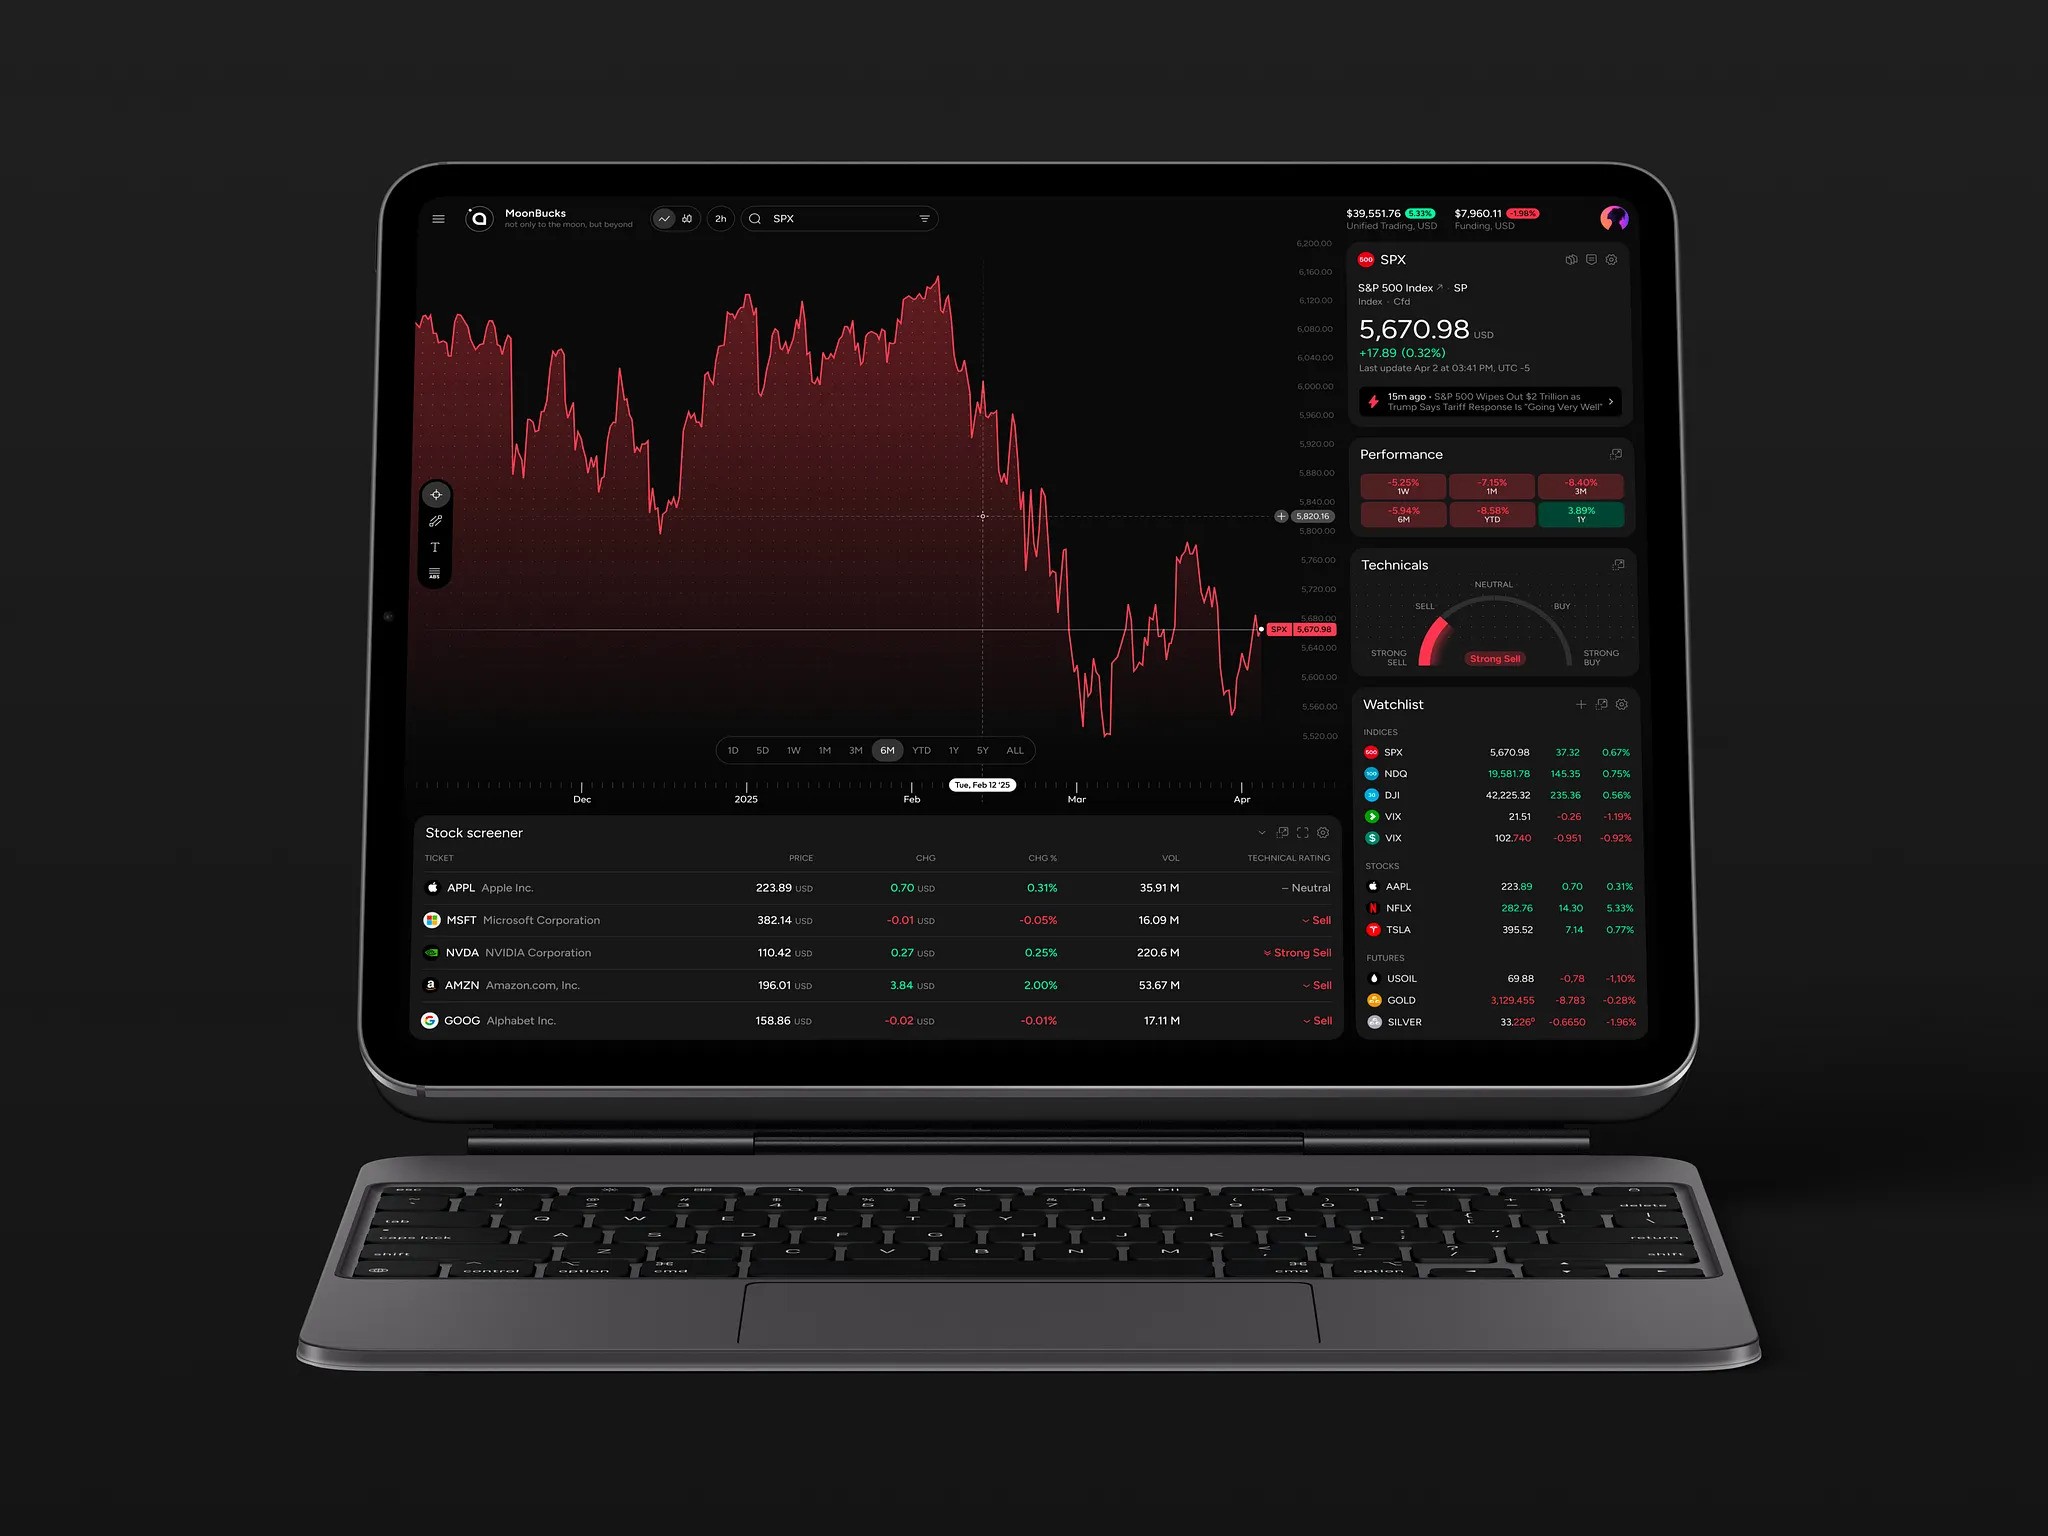
Frequent Obstacles in BI Dashboard Projects
Data Discrepancies
Inconsistent data is arguably the most pervasive challenge in dashboard development. Disparate systems often record identical information using varying formats, leading to mismatched labels, missing identifiers, or conflicting structures. While these inconsistencies are a normal byproduct of complex tech stacks, they must be systematically resolved to ensure accuracy.
Cluttered User Experience
Poor UX often stems from feature creep. Dashboards frequently expand organically as stakeholders request additional charts, filters, or metrics. Without strict design governance, the interface can quickly become overcrowded and unintuitive, resembling a complex cockpit that overwhelms rather than assists the user.
Performance Bottlenecks
Users expect instant responses, even when interacting with massive datasets. Achieving this speed often requires technical optimizations such as data caching, pre-aggregation, pagination, or refined database queries. In some cases, developers must manage expectations by explaining that visualizing millions of data points in real-time is impractical and may degrade performance.
Integration Complexities
Connecting diverse data sources introduces hidden difficulties. External APIs often have rate limits or undergo unexpected changes, while real-time analytics require careful balancing of speed, accuracy, and infrastructure costs. These integration hurdles can unexpectedly delay projects if not anticipated early.
Security and Compliance
Security considerations must be foundational, not an afterthought. Dashboards often display sensitive information, including financial records, personal customer data, healthcare details, or proprietary fintech metrics. Consequently, robust access controls, audit logging, encryption, and regulatory compliance are not optional add-ons; they fundamentally dictate the system’s architecture and development approach.
The Case for Partnering with BI Specialists
While some organizations possess the internal bandwidth—spanning product management, design, frontend and backend engineering, and data science—to build dashboards in-house, this is not always the reality. Many companies face resource gaps: data teams may excel at metric preparation but lack UI/UX expertise; product teams may understand user needs but lack frontend development capacity; or engineering teams may have the technical skills but no time to resolve conflicting KPI definitions.
Engaging experienced BI dashboard developers bridges these gaps. These specialists bring structure to initial planning, design intuitive and actionable interfaces, integrate complex or disparate data sources, and construct scalable frontend architectures that support long-term growth.
The ultimate objective is not merely to deploy a dashboard, but to create a tool that earns user trust. If stakeholders doubt the accuracy of the data or struggle to locate key insights, they will inevitably revert to using spreadsheets—a silent but immediate failure of the project.
Concluding Perspectives
The theoretical journey from raw data to informed decision-making appears straightforward: collect, visualize, and act. In practice, however, the process is far more complex. Data often contains inconsistencies, metric definitions vary across departments, and users simultaneously demand greater detail and simpler interfaces. Additionally, stakeholder requirements frequently evolve after viewing initial prototypes. These challenges are normal aspects of development.
Successful dashboards acknowledge this complexity. They provide teams with clear, reliable metrics, effective filtering options, legible visualizations, and sufficient context to enable confident decision-making without constant clarification.
For those embarking on business intelligence dashboard development, the best approach is to address the foundational questions first: What specific decisions will this tool support? Who are the primary users? Which data points are critical for trust? What are the data sources? How will discrepancies be handled?
Answering these questions before writing code may seem less glamorous than selecting chart types, but it is the most effective way to ensure the final product delivers genuine value.
About the Creator
Shakuro
We are a web and mobile design and development agency. Making websites and apps, creating brand identities, and launching startups.
Enjoyed the story? Support the Creator.
Subscribe for free to receive all their stories in your feed.
Comments
There are no comments for this story
Be the first to respond and start the conversation.