
AI Analytics Platform Development
Learn how AI analytics platform development works, including architecture, machine learning integration, and steps to build scalable data-driven systems.

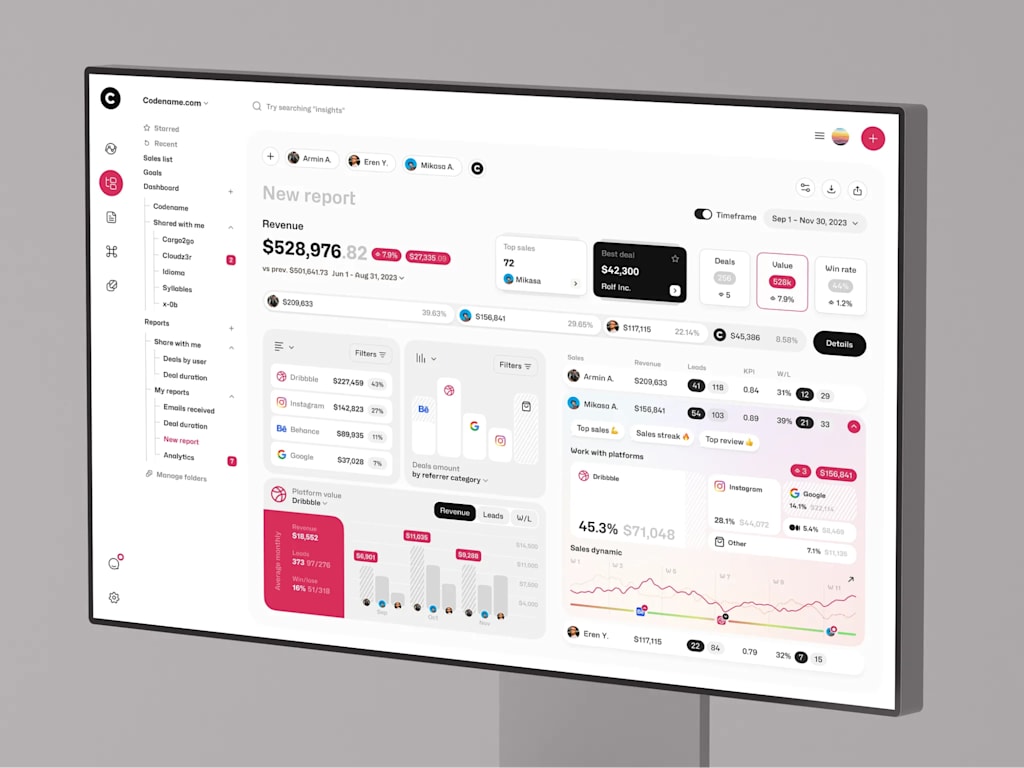
Why do certain clients only commit after multiple touchpoints, whereas others vanish after a single visit? Which behavioral indicators genuinely forecast attrition, and which metrics are merely vanity numbers on a screen? What drives revenue expansion in one demographic while another stagnates? Which routine operational tasks could be automated rather than manually audited weekly? Are organizations reacting to lagging indicators from past reports, or are they leveraging forward-looking signals to anticipate future trends?
These inquiries drive enterprises beyond the limits of conventional analytics. While standard dashboards serve a purpose for reviewing historical events, scaling products require more than retrospective data. They demand infrastructure capable of ingesting massive datasets, identifying hidden patterns, flagging potential threats, suggesting actionable steps, and accelerating decision-making across departments such as product development, sales, finance, operations, and customer support.
This is the domain of AI-driven analytics platform development. A bespoke AI analytics solution integrates data engineering, machine learning algorithms, real-time processing, and intuitive interface design into a unified ecosystem. Rather than allowing information to remain fragmented across CRMs, product tracking tools, ledgers, help desks, and spreadsheets, it synthesizes these disparate sources into structured, actionable intelligence.
For founders, CTOs, and product leaders, the appeal lies not in the "AI" label itself, but in tangible outcomes: improved forecasting accuracy, refined user segmentation, automated anomaly detection, predictive guidance, streamlined reporting, and rapid access to critical signals. In a SaaS context, this might involve pinpointing accounts at high risk of cancellation. In fintech, it could mean spotting irregular transaction activities or enhancing financial intelligence capabilities. For eLearning providers, it might reveal which educational pathways lead to course completion versus those that cause silent drop-offs.
Constructing such a system extends beyond mere machine learning. It necessitates robust backend architecture, dependable data pipelines, thoughtful user experience (UX) design, and frontend interfaces that clarify complex data. Consequently, successful teams often merge AI specialization with strong web development skills; a model is only valuable if the surrounding application can effectively capture, process, interpret, and present its outputs within the appropriate context.
This guide explores the internal mechanics of a machine learning analytics platform, detailing its core architecture, essential components, development lifecycle, ML layers, real-time logic, and visualization best practices. It also addresses common hurdles in building intelligent data systems, including data integrity, integration complexities, scalability, security protocols, and model upkeep.
Furthermore, we examine how AI analytics intersects with broader product categories like SaaS and fintech, where analytical capabilities often evolve from supportive features into central value propositions.
Defining an AI Analytics Platform
Companies typically begin considering predictive analytics development when standard reporting begins to hinder progress.
Initially, basic dashboards suffice. Founders monitor revenue, product managers track activation rates, sales teams observe conversion funnels, and finance teams export spreadsheets for meetings everyone has their numbers, creating an illusion of control.
However, as the product scales, data influxes from numerous channels: the application itself, CRM systems, payment gateways, support tickets, marketing campaigns, external services, and manual files. Teams begin referencing conflicting reports, debating data accuracy. Declines in engagement are identified only after impacting revenue. Dangerous user patterns exist within the data, yet go unnoticed until it is too late.
An AI analytics platform is designed to bridge this gap.
Fundamentally, it is a system that aggregates data, preprocesses it for analysis, applies machine learning where appropriate, and delivers results in an usable format. These outputs might include forecasts, anomaly alerts, churn probability scores, strategic recommendations, dynamic user segments, or adaptive dashboards that update with incoming data.
The primary distinction from traditional Business Intelligence (BI) lies in the nature of the questions answered. BI tools focus on hindsight, illustrating what has already occurred: sales declines, traffic spikes, engagement shifts, or comparative performance among user groups. While valuable, this approach often stops short of the most critical insight.
AI analytics advances into interpretation. It assists teams in anticipating future developments, identifying sources of risk, and prioritizing significant signals. For instance, while a BI report might indicate that paid users have reduced activity, an AI system can identify specifically which accounts altered their behavior, compare these patterns to historical precedents, and determine which customers are now prone to churning.
Custom AI analytics software generally falls into three categories:
- AI-Enhanced Business Intelligence: This is the most recognizable form for many organizations. It retains the familiar structure of reporting systems—dashboards, graphs, filters, and tables—but adds capabilities to highlight irregularities, incorporate predictive metrics, summarize trends, and prioritize key data points. It serves as an upgraded, more effective version of traditional BI rather than a replacement.
- Predictive Analytics Platforms: These systems center on forecasting metrics such as churn, revenue, demand, risk, user activity, conversion rates, and customer lifetime value. This approach is ideal for companies with sufficient historical data who wish to leverage it for strategic decision-making rather than just retrospective reporting.
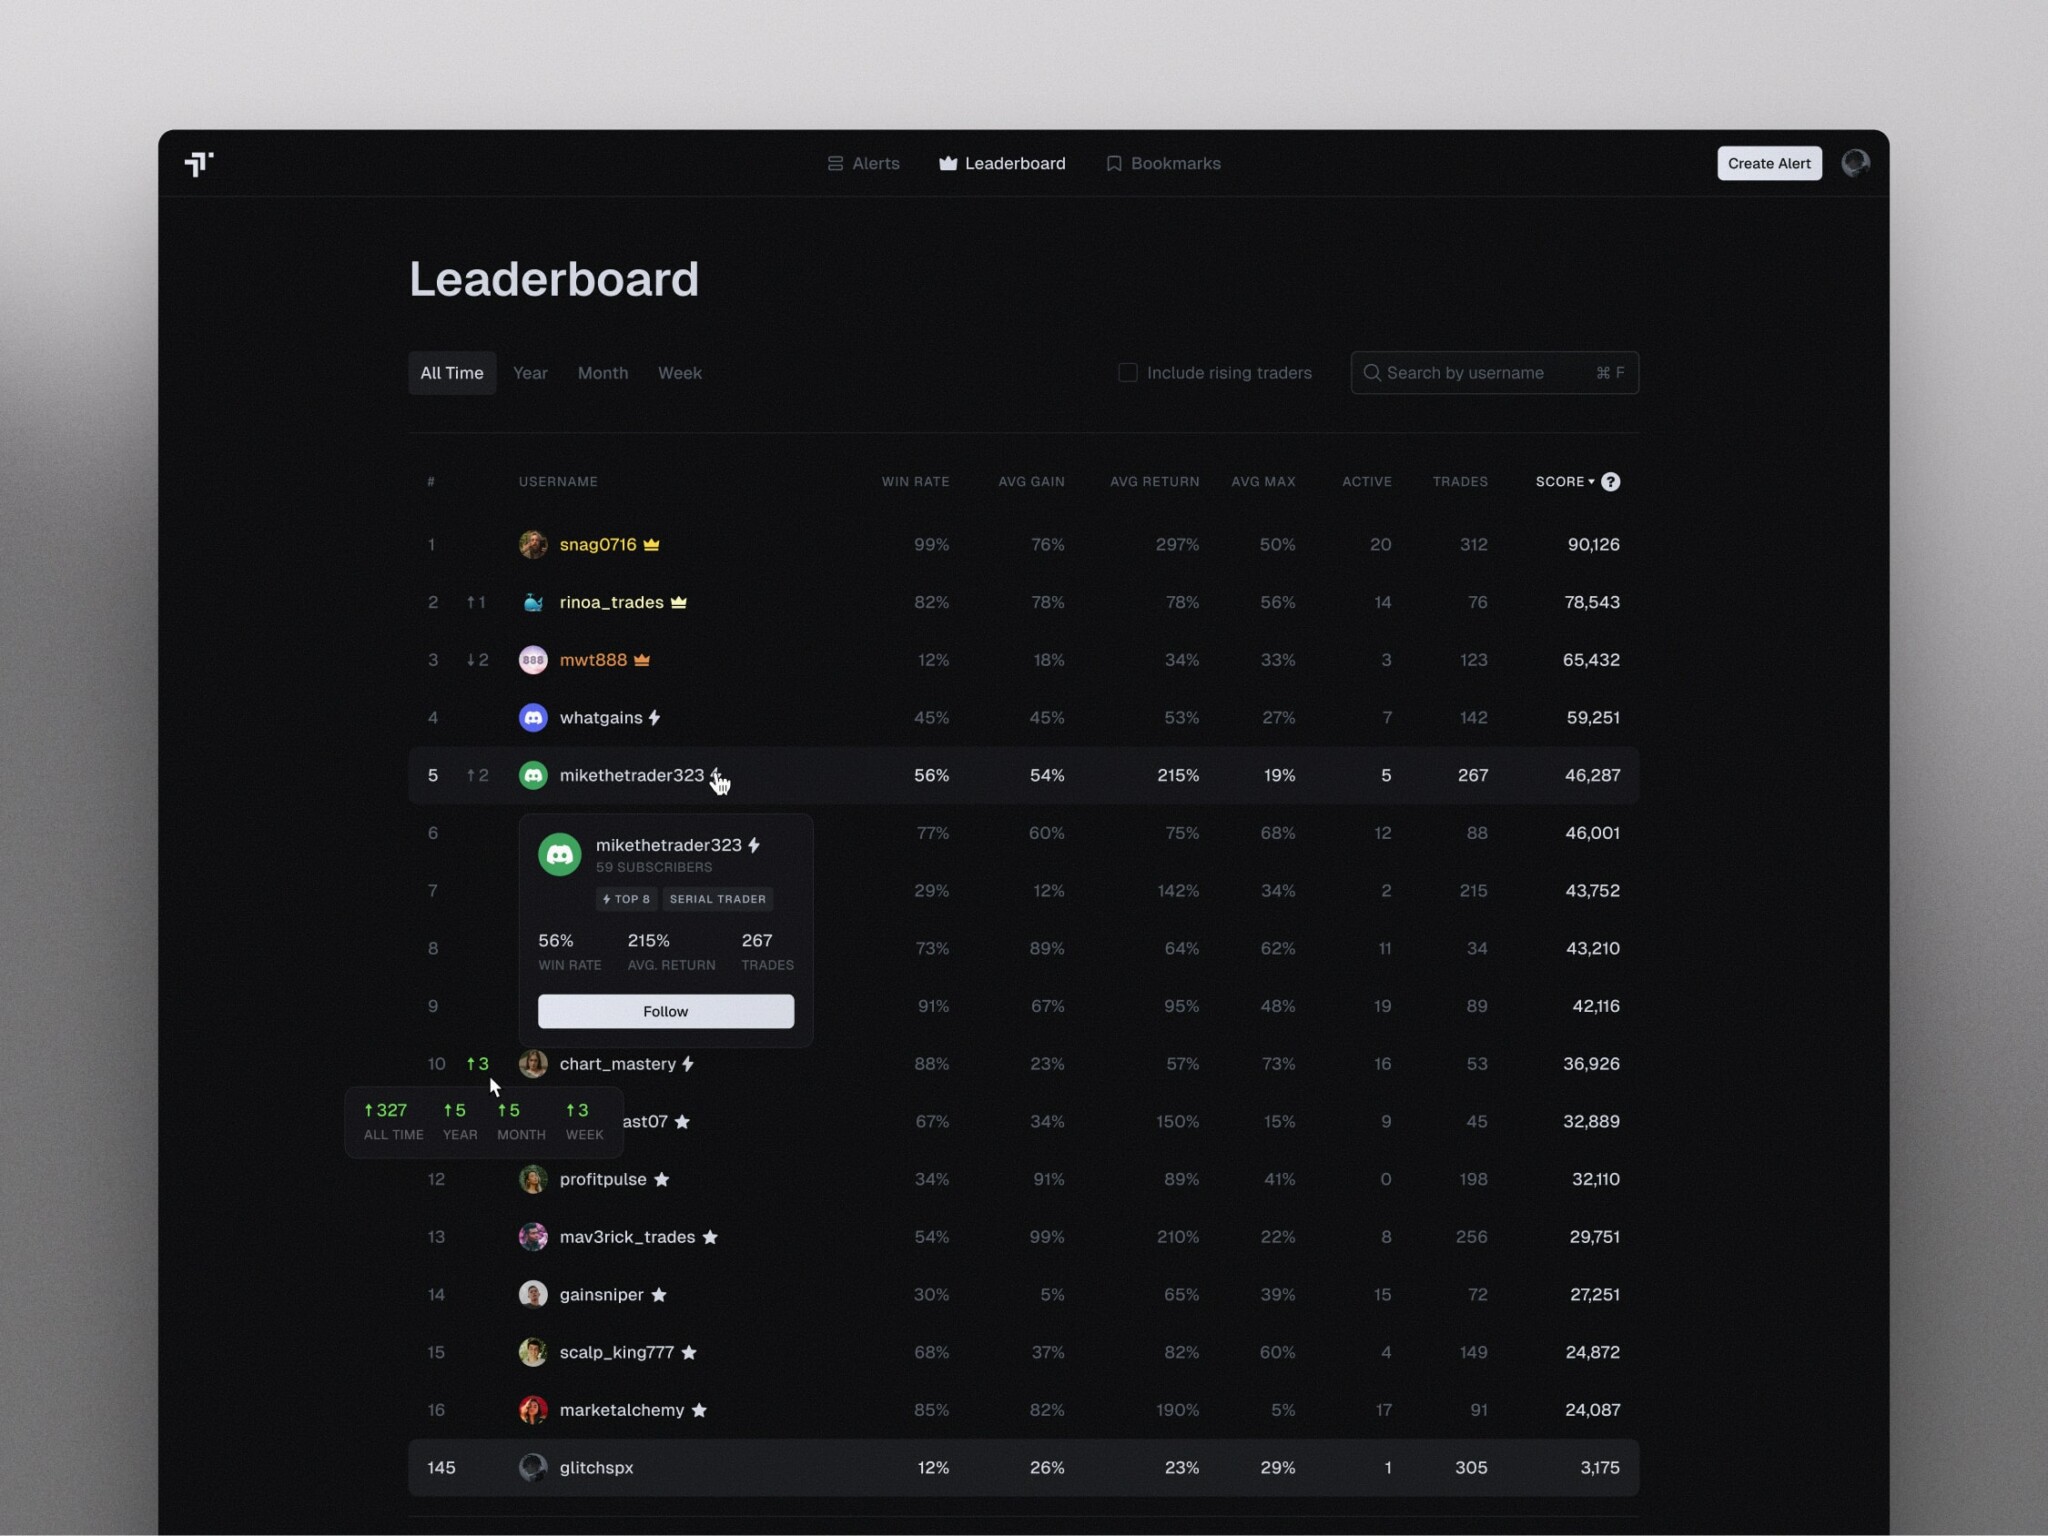
- Real-Time Analytics Systems: These platforms process data instantaneously, generating live dashboards, immediate alerts, or automated responses. This capability is crucial for industries where delayed reporting is unacceptable, such as trading platforms, payment processors, logistics networks, marketplaces, and financial monitoring tools.
Internally, most AI analytics platforms share a foundational structure:
- Data Pipelines: The first layer involves transporting information from various sources into a unified, clean stream. Though often invisible to the end-user, this layer determines the reliability of the entire system.
- Machine Learning Models: These are implemented when simple rule-based logic is insufficient. They handle outcome prediction, anomaly detection, user classification, behavior clustering, or next-best-action recommendations. Crucially, every model must address a specific business problem. Asking "Which customers are likely to leave?" is valid; asking "How can we add AI to our dashboard?" is not.
- Analytics Engine: This component bridges data, business logic, and model outputs. It computes metrics, enforces rules, monitors thresholds, constructs segments, and prepares insights for display, alerts, APIs, or internal workflows.
- Dashboards and Visualization: This layer ensures usability. An effective AI analytics dashboard avoids information overload, instead helping users identify changes, understand their significance, and determine subsequent actions.
- API Integrations: This layer connects the platform to the broader organizational toolkit, including SaaS applications, CRMs, payment processors, support systems, admin panels, and external data providers. Without this integration, analytics become an isolated silo. With it, insights are delivered directly into the workflows where decisions are executed.

Core Capabilities of AI Analytics Platforms
1. Data Unification and Preparation
The foundational element of any AI analytics system is not artificial intelligence itself, but rather robust data integration. In most organizations, information is fragmented: product events reside in application logs, billing details sit in payment gateways, and customer profiles are scattered across CRMs, support desks, administrative tools, and even legacy spreadsheets. Additional inputs may come from third-party APIs, marketing platforms, or partner systems.
Before any meaningful analysis can occur, the platform must aggregate these disparate sources. This involves extracting data from various databases and external services, then rigorously cleaning it by removing duplicates, standardizing formats, and resolving inconsistencies. Although this backend process is invisible to end-users, it is critical to the system’s integrity. If definitions vary between sources—for example, if “active user” is calculated differently in the product database versus the CRM—the resulting dashboard will not clarify issues; it will merely formalize existing confusion.
2. Applied Machine Learning
Machine learning (ML) in this context is functional, not decorative. Its primary role is to execute specific analytical tasks that rule-based systems cannot handle effectively.
- Predictive Modeling: ML algorithms estimate future outcomes, such as identifying customers at risk of churning, users likely to convert, accounts ready for upselling, or shifts in market demand. These models do not need to be flawless to provide value; even probabilistic scores help teams prioritize their efforts.
- Anomaly Detection: Rather than relying on human observation to spot irregularities, the system automatically flags deviations from the norm. This includes sudden drops in engagement, unusual payment patterns, unexpected traffic surges, or transactions that deviate from standard behavior.
- Recommendation Engines: These systems suggest actionable next steps. For customer success teams, this might mean highlighting high-priority accounts for outreach. For product teams, it could involve identifying user segments most likely to adopt new features.
A practical litmus test for any ML feature is specificity: Can you clearly define what the model is predicting or detecting? If the objective is vague, the feature is likely premature.
3. Real-Time Processing
While daily updates suffice for many reporting needs, certain scenarios demand immediate insight. In contexts like fintech, trading, logistics, or large-scale SaaS operations, delays can render data useless. A fraudulent transaction, a critical system failure, or a sudden pricing error requires instant attention, not next-day review.
Real-time analytics engines process streaming data as events occur, generating live dashboards, immediate alerts, or automated responses. The goal is not to display every metric in real time, but to ensure that high-priority signals are captured instantly. The challenge lies in signal filtering; if the system triggers alerts for every minor fluctuation, users will suffer from alert fatigue. Effective real-time analytics must distinguish between background noise and genuine incidents requiring intervention.
4. Intuitive Visualization and Interaction
Dashboards serve as the trust interface for the platform. They must guide users from observing a change to understanding its implications and deciding on subsequent actions different stakeholders have different needs. Executives may focus on high-level revenue and risk indicators, product managers on funnel metrics and cohort analysis, and finance teams on forecasts and transactional anomalies.
Overloading dashboards with excessive data is a common pitfall. While dense visualizations may look impressive in demonstrations, they hinder daily usability. Effective design prioritizes clarity through filters, segmentation options, drill-down capabilities, and contextual explanations that clarify why a model generated a specific score or alert. Here, UI/UX design is as crucial as backend engineering. Technologies like React are often employed to build responsive, component-based interfaces that remain fast and stable despite complex interactive requirements.
5. Automated Workflows and Intelligent Alerts
The final layer transforms insights into action through automation. Not every insight requires manual dashboard checks.
Automated systems can generate recurring summaries, such as weekly performance reviews or metric change logs. This eliminates the manual effort of compiling static reports, ensuring teams receive consistent, highlighted updates on key developments.
Urgent notifications are triggered when metrics breach predefined thresholds, forecasts shift significantly, or suspicious activities are detected. To remain useful, alerts must be contextual—explaining what changed, why it matters, and where to investigate further.
The ultimate goal is to integrate analytics directly into operational workflows. An effective alert might automatically create a support ticket, open a relevant customer profile, notify the appropriate stakeholder, or push data to another tool. By embedding insights into the workflow, analytics becomes an active participant in decision-making rather than a passive resource that is occasionally overlooked.

The Development Lifecycle of AI Analytics Platforms
1. Defining Strategy and Core Use Cases
Successful AI analytics development begins not with algorithms, but with identifying a specific, painful business problem that is too complex, slow, or costly to resolve manually. Common triggers include:
- Product teams struggling to understand sudden user drop-offs.
- Sales teams unable to distinguish high-intent leads from inactive contacts within a crowded CRM.
- Finance departments relying on guesswork rather than data for forecasting.
- Fragmented customer views where support, billing, and marketing data remain siloed.
Before technical requirements are drafted, the team must articulate the objective in plain language. Instead of vague goals like “implementing AI,” the focus should be on concrete outcomes: “predict churn,” “forecast demand,” “detect fraud,” or “identify retention drivers.”
This phase also determines the necessary data sources, which may include product logs, CRM entries, billing records, support tickets, marketing metrics, or external APIs. In practice, this data is rarely pristine; it often contains duplicates, formatting errors, or missing fields. Identifying these issues early is crucial. Furthermore, teams must agree on strict definitions for key metrics. Ambiguities—such as what constitutes an “active user” or a “qualified lead”—must be resolved before any code is written. Without standardized definitions, the final product may appear functional while delivering misleading insights.
2. User-Centric UX/UI Design
Analytics interfaces often fail because they attempt to satisfy every stakeholder simultaneously, resulting in cluttered, unusable dashboards. Effective design prioritizes role-specific needs:
- Executives require high-level summaries of growth, revenue, and risk.
- Product Managers need detailed funnel analysis and cohort comparisons.
- Finance Teams focus on forecast accuracy and revenue anomalies.
- Customer Success Managers benefit from prioritized lists of accounts requiring attention.
A well-designed dashboard guides the user through a logical narrative: What happened? Where did it happen? Which segment is affected? Only then should it offer deeper granularity. This approach is vital for building trust in machine learning outputs. Predictive scores or anomaly alerts must be accompanied by context—explaining the influencing factors and signal strength—so users understand the rationale behind the insight. The most effective interfaces are minimalist, presenting only the most critical information initially and allowing users to drill down as needed.
3. Selecting the Technology Stack
The technology stack should be dictated by product requirements, not trends. A daily reporting tool has different architectural needs than a real-time fintech platform.
- Backend: Python is a standard choice for AI-centric products due its robust ecosystem for data processing and machine learning. It pairs well with frameworks like FastAPI to create maintainable services for dashboards and integrations. Node.js is another viable option for API-heavy architectures.
- Machine Learning: Libraries such as TensorFlow or PyTorch are powerful for complex tasks like forecasting and classification. However, simpler models are often preferable if they are easier to interpret, test, and maintain.
- Data Processing: For streaming data, Apache Kafka is ideal. For large-scale batch processing, Apache Spark is a strong candidate. These tools add operational complexity and should only be introduced when scale or speed demands justify them.
- Frontend: React is widely used for analytics dashboards due to its component-based architecture, which supports interactive features like filters, dynamic charts, and role-based views.
- Database & Storage: PostgreSQL suits structured application data, while BigQuery or similar warehouses handle heavy analytical workloads.
- Infrastructure: Docker ensures environment consistency, while Kubernetes facilitates scaling and orchestration as the platform grows.
The goal is a stack that efficiently collects, processes, and displays data while remaining maintainable post-launch.
4. Building Data Pipelines and Architecture
Once the use case and design are established, the focus shifts to the invisible backbone of the system: the data pipeline. This infrastructure moves data from source systems into a centralized environment for cleaning, transformation, and storage.
Depending on latency requirements, this may involve scheduled batch jobs or continuous real-time processing. Common methodologies include:
- ETL (Extract, Transform, Load): Data is cleaned and structured before storage.
- ELT (Extract, Load, Transform): Raw data is stored first and transformed within the warehouse, offering greater flexibility.
Architectural decisions regarding storage, access control, logging, and monitoring are critical here. Systems that perform well with small test datasets often struggle under production loads. Therefore, the architecture must be designed for scalability without introducing premature complexity. The ultimate objective is reliable data delivery: ensuring that information arrives in the correct format and location, fostering user trust in the displayed insights.
5. Integrating Machine Learning Models
This phase transitions machine learning from experimental notebooks to production-grade features. Models are trained on prepared data and evaluated for practical utility. Deployment strategies vary:
- Batch Processing: Models update predictions on a schedule (e nightly churn scores).
- Real-Time Inference: Models respond instantly to events (e.g., fraud detection during transactions).
Integration is key. Predictions must be embedded directly into workflows where they drive action. A risk score should trigger a review process; a recommendation should link to the next step; an anomaly alert should provide sufficient context for assessment.
Moreover, model maintenance is integral to the product lifecycle. As user behavior and business conditions evolve, models can degrade. Continuous monitoring and retraining protocols must be established to ensure long-term accuracy.
6. Rigorous Testing and Validation
Validation extends beyond functional testing of buttons and links. It requires verifying data integrity and model performance.
- Data Accuracy: Engineers must confirm that events are tracked correctly, fields are mapped properly, and dashboard metrics match source systems. Discrepancies in revenue, churn, or active user counts can erode trust immediately.
- Model Efficacy: Predictive models must be tested against new data to ensure they generalize well. Anomaly detectors should balance sensitivity with precision to avoid false positives. Recommendation engines must be evaluated for practical usefulness, not just technical accuracy.
This stage involves both technical verification and business review. Domain experts should assess whether alerts and insights make sense in a real-world context. Thorough validation prevents the launch of a polished-looking product that delivers unreliable numbers.
7. Deployment, Scaling, and Support
Deployment marks the transition to live operations. Initial releases should focus on a core set of features—key dashboards, essential models, and critical alerts—rather than attempting to launch everything at once. This allows teams to observe actual usage patterns, identify ignored features, and pinpoint performance bottlenecks.
Scaling involves optimizing infrastructure to handle increased data volumes and user activity without compromising interface speed. Real-time pipelines may require enhanced monitoring, and databases may need optimization.
Post-launch support is equally critical. Analytics platforms are dynamic; new metrics emerge, integrations break, and data schemas change. Ongoing maintenance ensures the platform remains relevant and reliable. A successful deployment strategy prioritizes stability, clarity, and flexibility, allowing the system to evolve alongside the business decisions it supports.
Navigating Common Pitfalls in AI Analytics Development
The concept of AI-driven analytics is appealing in theory, but implementation often stumbles when confronted with the messy reality of enterprise data. The following challenges are typical hurdles teams face during development.
1. The Data Quality Foundation
The most immediate obstacle is rarely the algorithm itself, but the state of the underlying data. Organizations may possess vast archives of user records, transaction logs, support tickets, and CRM entries, yet this volume does not equate to readiness. Data is frequently fragmented: event tracking methods may have shifted across product updates, critical fields may be null, and user identities might be inconsistent across different systems. Furthermore, key metrics are often poorly defined, leading to widespread usage of ambiguous figures in legacy reports.
If this foundational layer is compromised, the entire system becomes unreliable. Dashboards may appear polished, and models may generate scores, but discrepancies between the analytics and actual business performance will quickly emerge. Once stakeholders lose confidence in the data’s accuracy, rebuilding that trust is significantly more difficult than building the initial model.
2. Model Drift and Maintenance
High performance in a testing environment does not guarantee success in production. Machine learning models are static snapshots of past realities, while businesses are dynamic. Changes in user behavior, the emergence of new customer segments, or adjustments to pricing and features can render a previously accurate model obsolete. This phenomenon, known as model drift, means that AI analytics cannot be a "set it and forget it" endeavor.
Continuous validation is essential. Models must be regularly evaluated against real-world outcomes. False positives should be investigated, and forecasts compared against actual results. For instance, if a system flags an account as high-risk, there must be a feedback loop to determine whether that prediction was actionable or merely noise. Without this ongoing monitoring, model relevance degrades over time.
3. Scalability Constraints
Scalability issues often surface only after the Minimum Viable Product (MVP) proves successful. Initially, a platform may handle limited datasets and a few dashboards with ease. However, as adoption grows—more teams join, additional integrations are added, and report complexity increases—the system may begin to lag. Data refresh rates may slow, and interfaces may become unresponsive.
This does not imply that enterprise-grade infrastructure is required from day one. Rather, the architecture must be designed with flexibility in mind. Developers should distinguish between components that can remain simple initially and those that require robust scaling capabilities to accommodate future growth, avoiding architectural dead ends that necessitate costly rewrites later.
4. Integration Complexity
AI analytics platforms rarely operate in isolation; they depend on a web of external systems, including CRMs, payment gateways, product databases, support tools, and third-party APIs. Each source introduces its own quirks: differing data formats, API rate limits, permission structures, and subtle inconsistencies. A significant portion of development effort is often consumed by engineering reliable connectors that ensure seamless data flow without breaking whenever an upstream provider modifies their interface.
To mitigate these risks, the most effective approach is to constrain the scope of the initial release. Instead of attempting to boil the ocean, teams should:
- Focus on a single, high-impact use case.
- Integrate only the most critical data sources.
- Rigorously clean and define the metrics that matter most to stakeholders.
- Validate models against concrete business logic.
A compact, trustworthy platform that delivers reliable insights is far more valuable than a sprawling system filled with impressive but unreliable visualizations. Trust, not breadth, is the primary currency of successful analytics adoption.
The Strategic Advantage of Partnering with AI Analytics Experts
Developing an AI analytics platform is a deceptively complex endeavor. While the end product—a sleek dashboard with charts and predictive scores—may appear straightforward, the underlying engineering required to make it reliable is intricate. The true challenge lies not in the visualization, but in the infrastructure: ensuring data integrity, managing update frequencies, handling model errors gracefully, and presenting insights so clearly that users can act on them without needing a data scientist’s interpretation.
Engaging a specialized development partner helps organizations avoid common pitfalls and inefficient detours. Here is why external expertise is often critical:
1. Distinguishing Hype from Utility
Experienced developers can differentiate between genuine AI opportunities and features that are merely technically impressive but practically useless. They understand that different problems require different solutions: churn prediction and anomaly detection may need machine learning, while other tasks might be better served by simple rule-based logic in the early stages. This discernment prevents over-engineering and ensures resources are focused on high-impact capabilities.
2. Building for Scale from Day One
Analytics platforms rarely remain static. They typically start with limited data sources but quickly expand to include numerous integrations, user roles, models, and reports. A casual approach to initial architecture can lead to technical debt, forcing a costly rebuild of the data layer just as the product begins to deliver value. Specialized teams design scalable architectures that accommodate growth without requiring fundamental restructuring later.
3. Accelerating Time-to-Market
Most companies do not need a massive enterprise suite immediately. The most effective strategy is often to launch a Minimum Viable Product (MVP) focused on a single, high-value use case. An experienced development team can help define this scope, connect essential data sources, and design a clear, functional interface. This approach keeps the initial release focused and actionable, rather than allowing it to drift into a prolonged technical experiment.
4. Translating Business Logic into Technical Reality
The primary value of an external partner is not domain knowledge—they will not know your business better than you do—but rather their ability to translate your business requirements into a robust technical system. They build the necessary components—data pipelines, models, dashboards, alerts, and infrastructure—in a way that ensures reliability and future scalability.
Conclusion: The Chain of Value
An AI analytics platform is only as strong as its weakest link. Success depends on a cohesive chain:
- Clean Data Ingestion: Information must arrive accurately and consistently.
- Relevant Modeling: Algorithms must address specific, real-world business questions.
- Actionable Visualization: Insights must be presented in a format that is easy to interpret.
- Decision Enablement: Users must be able to translate these insights into concrete actions.
If any part of this chain fails, the platform’s value diminishes. Overly complex dashboards create cognitive load rather than clarity, while fragile architectures hinder long-term utility.
The most successful systems are built iteratively. They begin with a narrow focus on a specific decision-making process, supported by the necessary data and targeted modeling. Once the platform proves its worth by becoming indispensable to users, it can then expand. Starting small, proving value, and scaling deliberately is the surest path to building an analytics tool that truly drives business outcomes.
About the Creator
Shakuro
We are a web and mobile design and development agency. Making websites and apps, creating brand identities, and launching startups.
Enjoyed the story? Support the Creator.
Subscribe for free to receive all their stories in your feed.
Comments
There are no comments for this story
Be the first to respond and start the conversation.