
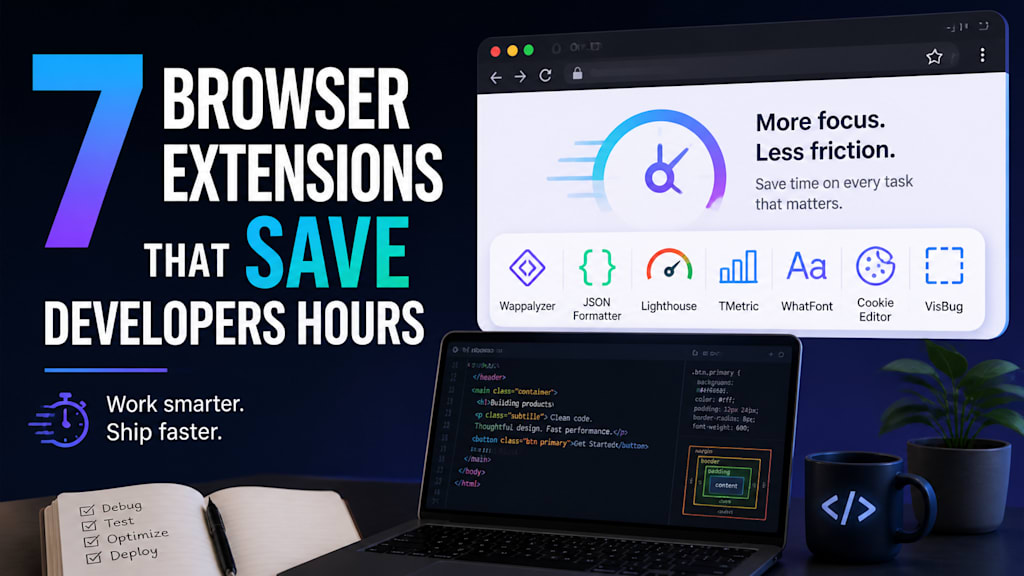
7 Browser Extensions That Save Developers Hours Every Week
Browser extension tools

Let’s be honest. Most developers don’t lose time because coding is hard. We lose time because the web is chaotic.
You open a doc page to check one API method and somehow end up with 17 tabs open. You copy JSON from an API response and paste it into a notes file because it’s unreadable. You inspect a layout bug, test a color, check headers, switch devices, validate cookies, copy selectors, and by the end of it, you’ve spent 40 minutes on something that should have taken 8.
The problem usually isn’t your code. It’s the tiny bits of friction surrounding the code.
A lot of modern development work happens inside the browser, but most of us still use it like casual users. That’s a mistake. The right browser extensions can turn Chrome into a real debugging and productivity environment instead of just a tab graveyard.
These aren’t gimmicks. They’re practical tools that help with front-end debugging, API inspection, accessibility checks, design validation, and everyday workflow speed. Here are seven browser extensions that can genuinely save developers hours every week.
1. Wappalyzer: Instantly See What a Site Is Built With
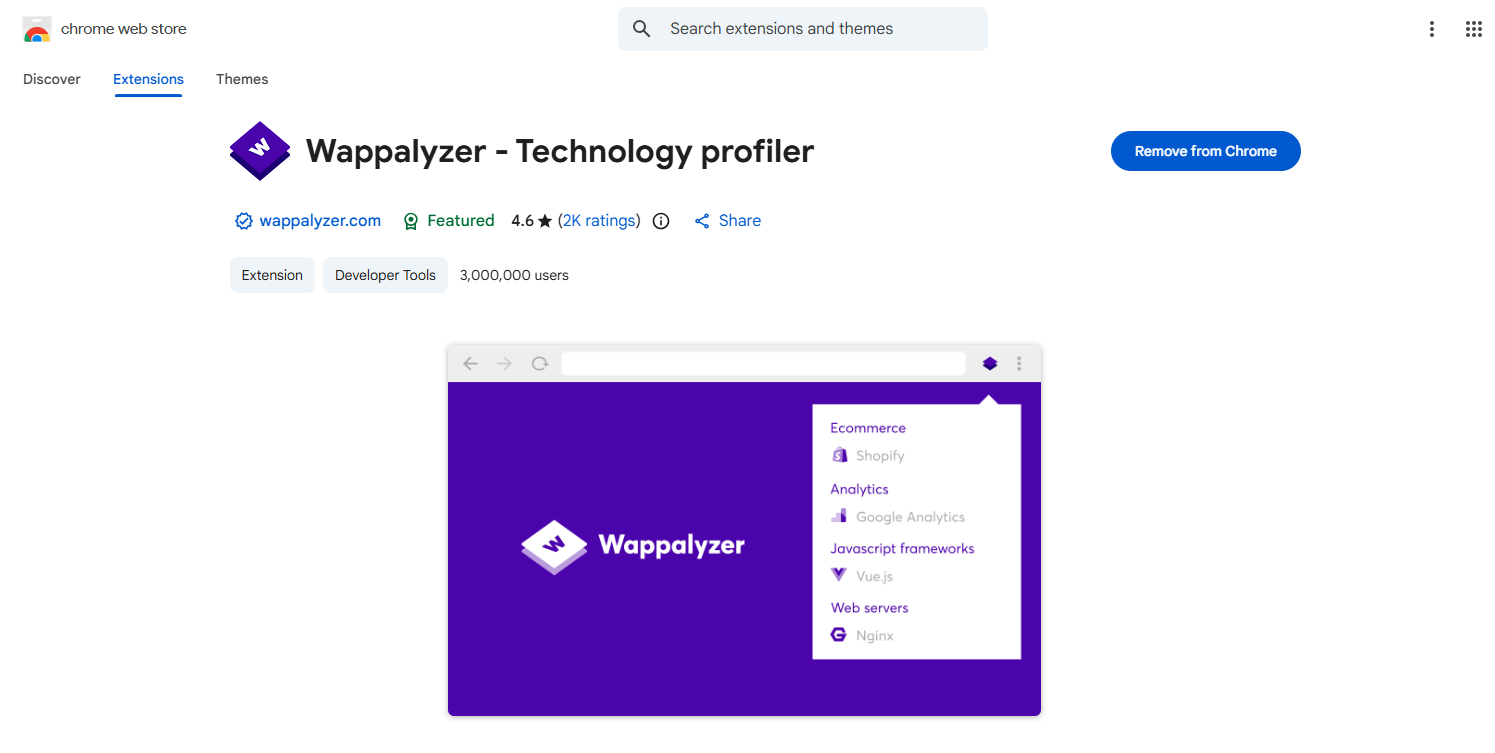
Wappalyzer tells you what technologies a website is using. Frameworks, CMS, analytics tools, JavaScript libraries, CDNs, payment platforms, marketing tools, and more.
This sounds simple, but it saves a surprising amount of time.
Say you land on a site and want to know whether it’s running React, Next.js, WordPress, Shopify, or something custom. Instead of digging through source code, network requests, and script names manually, Wappalyzer gives you a quick overview in one click.
That makes it useful for developers, freelancers, SEO professionals, and anyone doing competitor research. If you work with clients, it also helps when you inherit a project and need a fast technical snapshot before touching anything.
Where it helps most:
- Quick competitor tech stack checks
- Auditing client websites
- Identifying frameworks before debugging
- Spotting third-party tools affecting performance
It won’t replace a full technical audit, but it gets you from “What am I looking at?” to “Okay, now I know where to start” almost instantly.
2. JSON Formatter: Because Raw JSON Shouldn’t Hurt
Every developer ends up staring at ugly API responses at some point.
You hit an endpoint, open a response, and get a wall of compressed JSON that looks like static noise. Yes, you can paste it somewhere else. Yes, your IDE can format it. But that breaks flow.
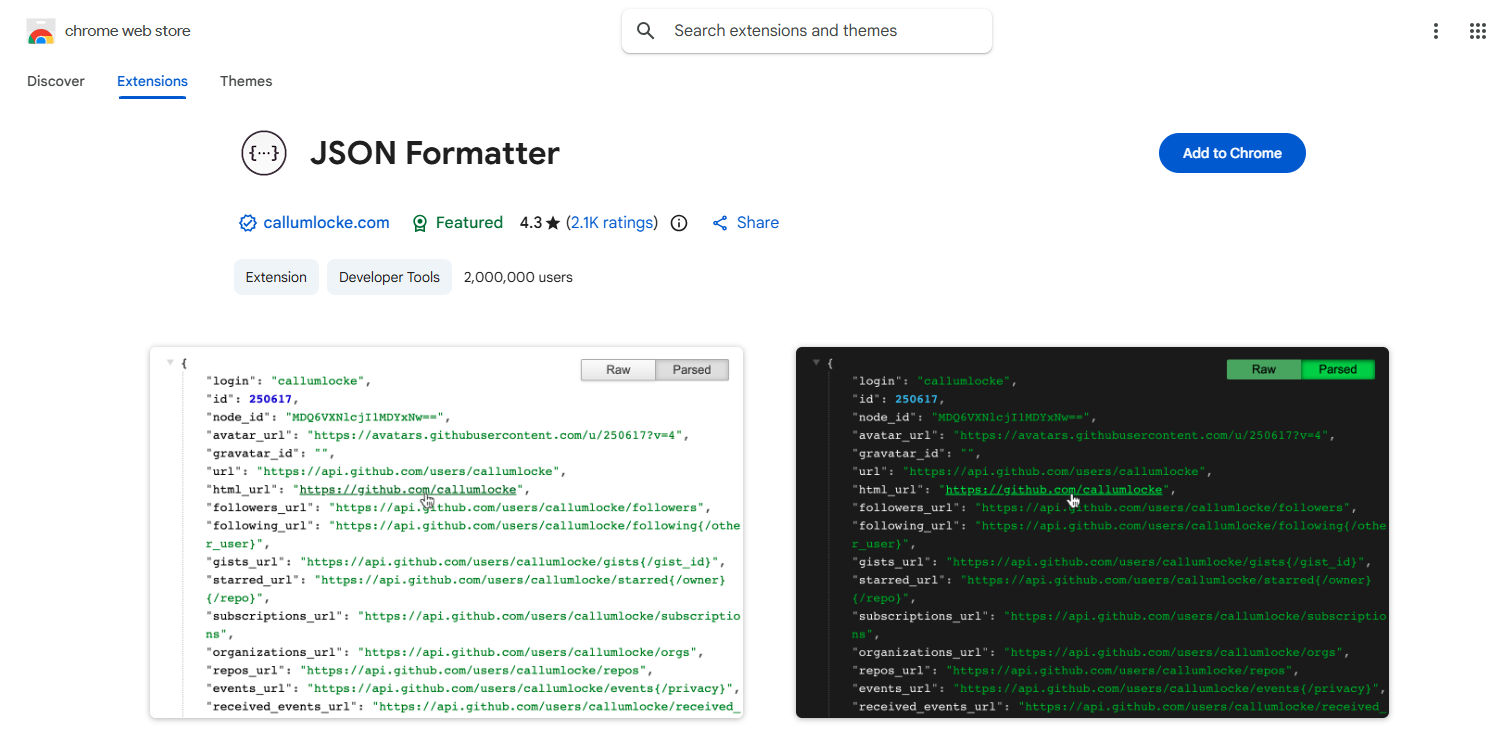
A good JSON Formatter extension makes the browser readable again. It prettifies JSON instantly, lets you collapse objects, search values, inspect nesting, and understand structure without leaving the tab.
This is especially useful when debugging APIs, webhooks, config files, and third-party integrations. Instead of mentally parsing brackets and commas, you can focus on what’s actually wrong.
The value here is not glamour. It’s momentum. When you’re debugging, even tiny interruptions cost time.
3. Lighthouse: Performance and Quality Checks Without Guesswork
Lighthouse is one of those tools developers know about, but many still underuse.
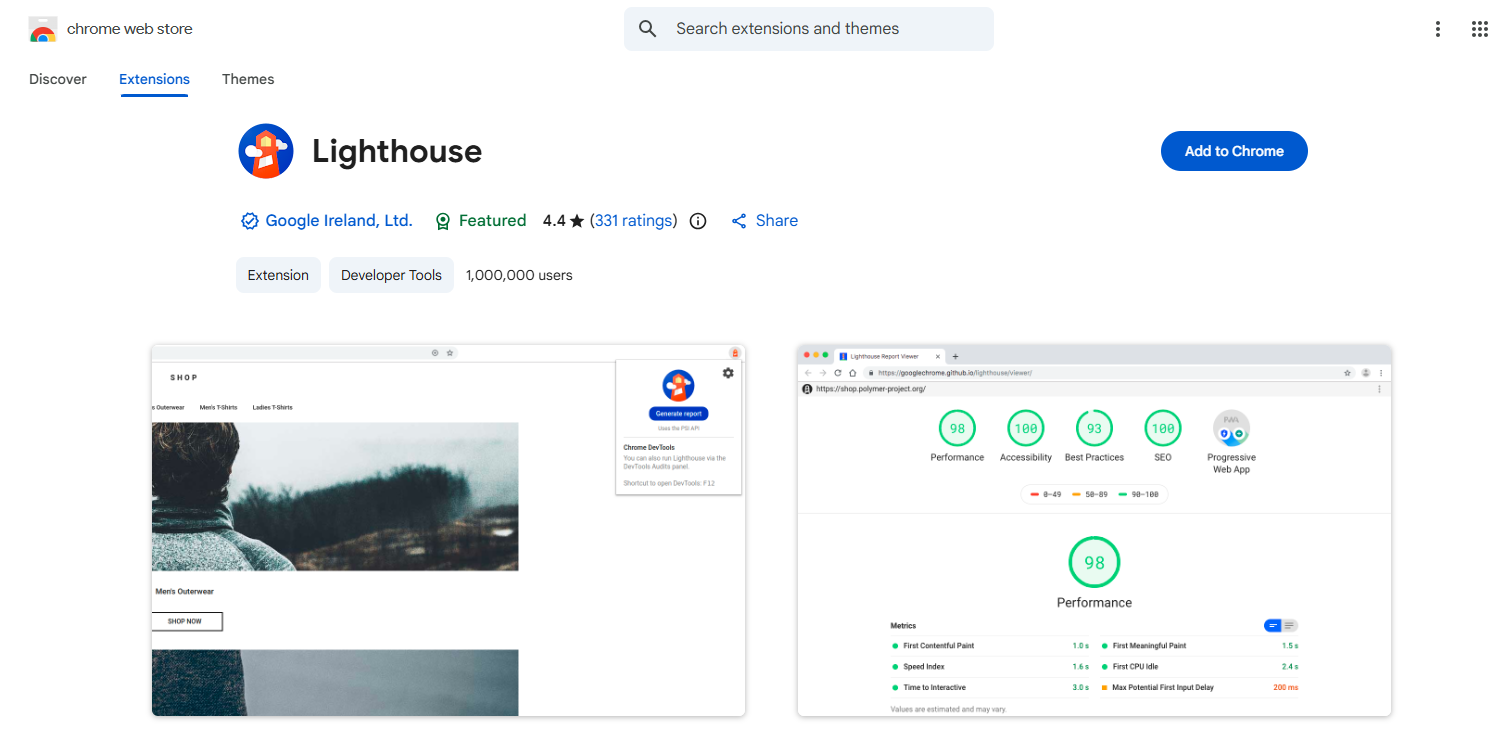
If you care about page speed, accessibility, SEO basics, and best practices, Lighthouse gives you a quick way to audit a page and spot obvious problems before they become bigger ones. Slow images, layout shifts, missing labels, oversized scripts, and weak caching patterns often show up fast.
It’s useful because it turns vague concerns into specific issues.
Instead of saying, “This page feels slow,” you get something closer to, “Largest Contentful Paint is being delayed by render-blocking resources.” That’s actionable.
For front-end teams, it’s also a useful reality check. A page can look polished and still be performing badly on real-world conditions. Lighthouse helps surface that early.
Use it when:
- Reviewing landing pages before launch
- Checking performance regressions
- Catching accessibility misses
- Running quick pre-deployment audits
It’s not the whole story, but it’s one of the fastest ways to move from assumption to evidence.
4. TMetric: Track Developer Time Without Breaking Workflow
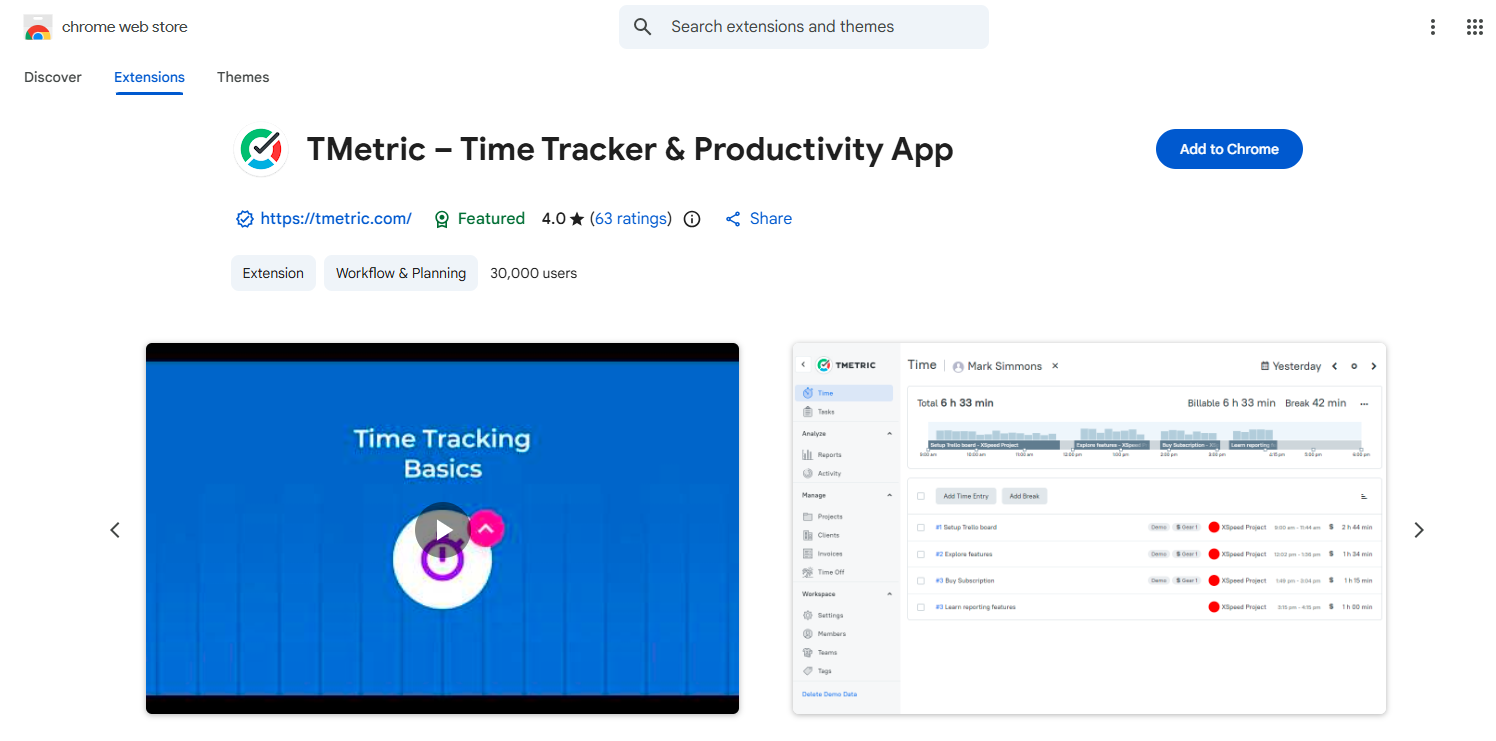
TMetric browser extension helps developers track time without leaving the tools they already use, such as Jira and Asana. With one-click time tracking, you can track actual time against estimates, separate billable from non-billable work, and rely on smart reminders or auto-filled timesheets to keep records accurate with less manual effort.
It also makes it easier to track progress and bill clients accurately. That “$15K/month retainer” may actually cost $22K in loaded developer time, and without clear tracking, it is hard to know which clients are profitable. TMetric helps developers increase billable utilization from 60% to 85%, reduce invoicing time from 4 hours to 15 minutes, and win disputed hours with proof. By linking deliverables and tasks directly to tracked time, supporting billable rates, roles, and rounding rules, and creating invoices from tracked time in one click, TMetric gives teams a clearer view of what should actually be billed.
Where it helps most:
- One-click time tracking from existing developer tools
- Tracking actual time vs. estimates to keep projects on track
- Capturing billable and non-billable hours accurately
- Linking tasks and deliverables directly to tracked time
- Create invoices from tracked time or free-form in one click
You can easily install the TMetric extension in any browser you prefer. It will help you stay productive throughout the day, get precise reports, and bill your clients accurately.
5. WhatFont: Stop Guessing Typography
Typography issues waste more development time than people admit.
Maybe design says the heading uses one font but production shows another. Maybe a fallback font is loading. Maybe a third-party widget is injecting its own styles. Maybe you just need to recreate a layout from a live reference.
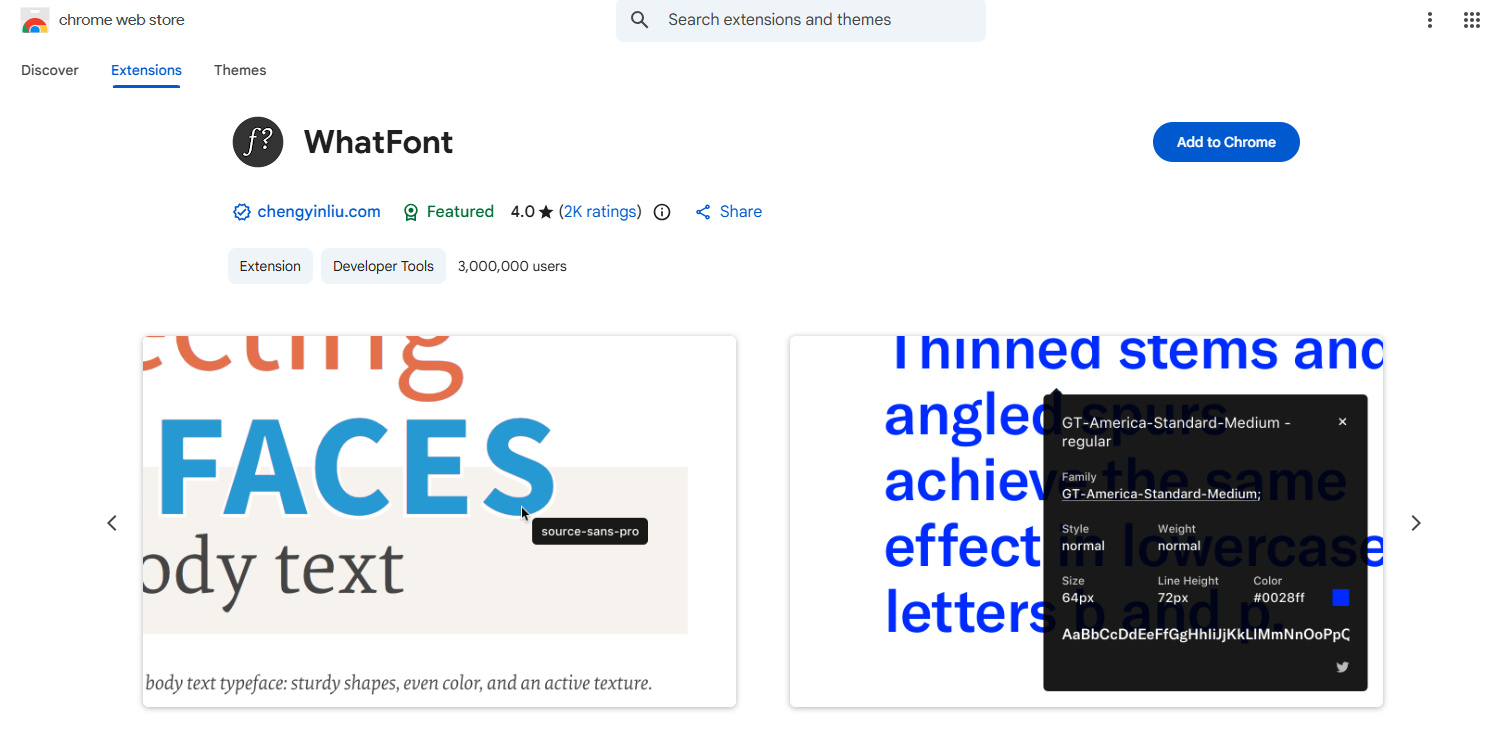
WhatFont solves that quickly. Hover over text and it tells you the font family, size, weight, line height, and often other useful style details.
Again, this is not about doing magic. It’s about reducing friction. Instead of opening DevTools, selecting nodes, expanding computed styles, and scanning through font stacks, you get the answer in seconds.
For UI developers, marketers, designers, and anyone rebuilding pages from visual references, it saves a lot of low-level inspection time.
6. Cookie-Editor: Faster Testing for Auth and Session Problems
Authentication bugs are annoying because they’re rarely dramatic. They’re confusing.
A user stays logged in when they shouldn’t. A session expires too early. A cookie isn’t being set in one environment. A feature flag behaves differently between accounts. These issues often come down to browser state.
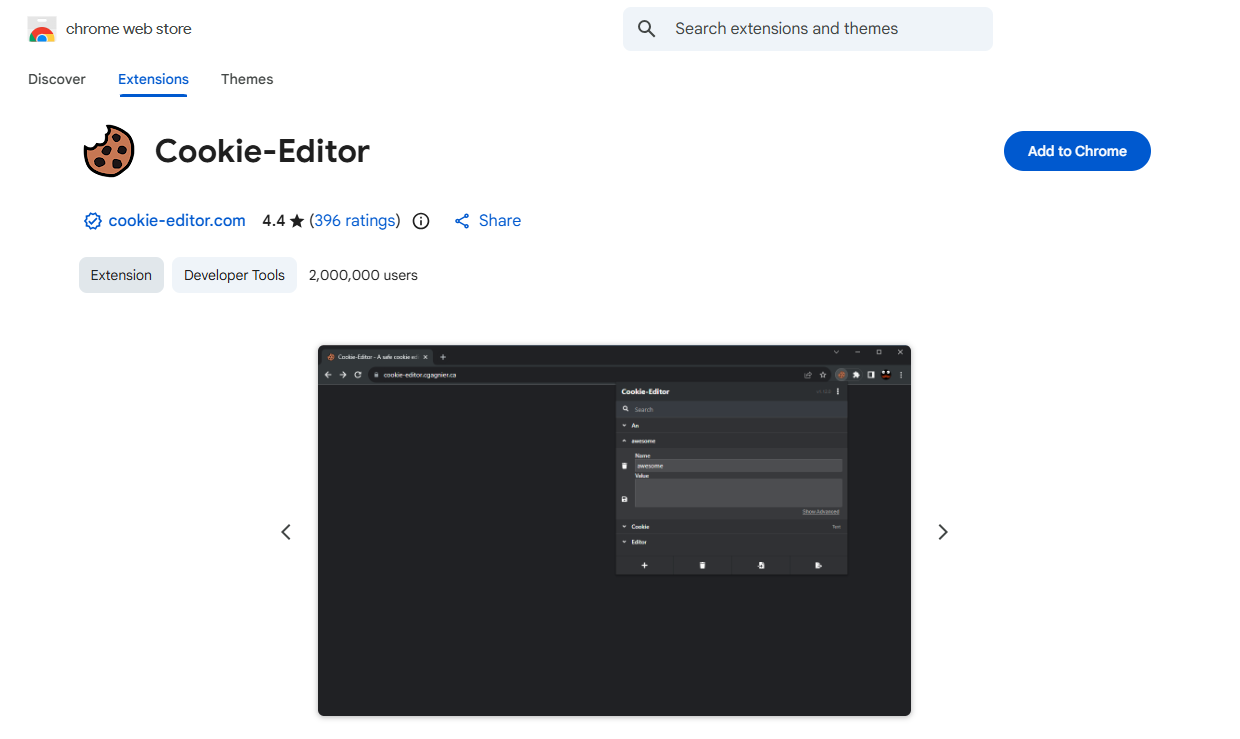
Cookie-Editor gives you a fast way to inspect, edit, delete, export, and import cookies without digging through multiple panels. That makes it especially useful when testing login flows, session behavior, role-based access, and multi-account scenarios.
This is one of those tools that becomes valuable the first time you’re trying to reproduce a “works for me, fails for client” problem.
Instead of clearing everything blindly and starting over, you can work with precision. That means faster debugging and fewer random resets.
7. VisBug: Edit the Front End Directly in the Browser
VisBug feels like a bridge between design experimentation and development debugging.
It lets you inspect, move, edit, and visually tweak elements on a live page. You can adjust spacing, test text, check alignment, and get a clearer sense of layout behavior without immediately editing source files.
No, it doesn’t replace proper coding. That’s not the point.
The value is speed. When you’re trying to answer questions like “Would this look better with more padding?” or “Why does this card feel off?” or “How much space do we actually need here?” a visual editing layer can help you validate ideas before touching the codebase.
That’s especially useful in team discussions. It’s easier to align with designers, PMs, or clients when you can test visual changes live instead of describing them abstractly.
The Real Benefit: Less Friction, Better Focus
The common thread across all these extensions is simple. They reduce the number of tiny tasks that interrupt real work.
You’re still thinking. You’re still debugging. You’re still making decisions. But you’re doing less tab-hopping, less manual checking, less repetitive inspection, and less context-switching.
That matters because productivity usually doesn’t disappear in one big event. It leaks out in small moments.
A minute here to inspect a font. Three minutes there to format JSON. Five more to confirm a framework. Another few minutes to test cookies. None of those feel huge individually. Together, they quietly eat your day.
Good developer tools don’t just help you code faster. They help you stay in flow longer.
Getting Started Without Installing Everything
Don’t install all seven at once just because they sound useful.
Start with the one that solves the kind of problem you hit most often.
If you do front-end work, begin with WhatFont, ColorZilla, or VisBug. If you debug APIs and integrations, start with JSON Formatter and Cookie-Editor. If you audit websites or inherit unfamiliar projects, Wappalyzer and Lighthouse are easy wins.
Use one or two consistently for a week. You’ll know pretty quickly whether they’ve earned a permanent place in your browser.
The goal isn’t to collect extensions. It’s to remove friction from the work you already do every day.
Frequently Asked Questions
Do browser extensions slow down development environments?
Some do, especially if you install too many. But a small set of focused, well-maintained extensions usually has minimal impact compared to the time they save. The key is being selective.
Are these extensions only useful for front-end developers?
Not at all. Front-end developers may get the most obvious value, but back-end developers, QA engineers, product teams, SEO professionals, and technical marketers can all benefit depending on their workflow.
Shouldn’t DevTools already be enough?
DevTools is powerful, but extensions reduce the steps required for common tasks. They’re not replacing DevTools. They’re making frequent actions faster.
Are browser extensions safe to use on client projects?
Usually, yes, but you should still be careful. Review permissions, use trusted extensions, and avoid anything sketchy when working with sensitive environments or production data.
What’s the best extension to start with?
If you’re unsure, start with Lighthouse or Wappalyzer. They’re broadly useful, easy to understand, and deliver immediate value.
The Bottom Line
Most developers don’t need more motivation. They need fewer interruptions.
The right browser extensions won’t make you a better engineer overnight, and they won’t fix unclear requirements or broken processes. But they will make the everyday work around development smoother, faster, and less annoying.
And honestly, that’s where a lot of productivity gains come from.
The best tools are usually the ones that remove just enough friction for you to keep moving.
Send me your exact topic, and I’ll write another one in this same dev.to style.
About the Creator
Tony Tyler
I'm a tech writer passionate about writing new technology, social media, digital marketing etc. I always seeking to get new tech updates. Let's explore some new things of the tech world with me.
Enjoyed the story? Support the Creator.
Subscribe for free to receive all their stories in your feed.
Comments
There are no comments for this story
Be the first to respond and start the conversation.