
How Evers Beat Walker
Democrats Surge, Suburbs Flunk Gov

In 2014, Wisconsin Governor Scott Walker beat bicycle entrepreneur Mary Burke by 136,793 votes. In 2018, Walker lost to State Superintendent of Education Tony Evers by a margin of 30, 576. What factors shifted over 167,000 votes between the two elections? There were several.
Walker Fatigue:
After eight years in office, voters are frequently ready for a change in leaders, and Walker turned out to be a victim of that effect. Walker tried to rebrand himself, but after eight years in office, people’s opinions about the governor were solidified. Walker tried to paint himself as “the education governor” which came off as even more ridiculous when he was running against a veteran educator. Walker also tried to come out as a champion of patients with pre-existing conditions, asking voters to ignore that he supported a lawsuit to repeal the Affordable Care Act.
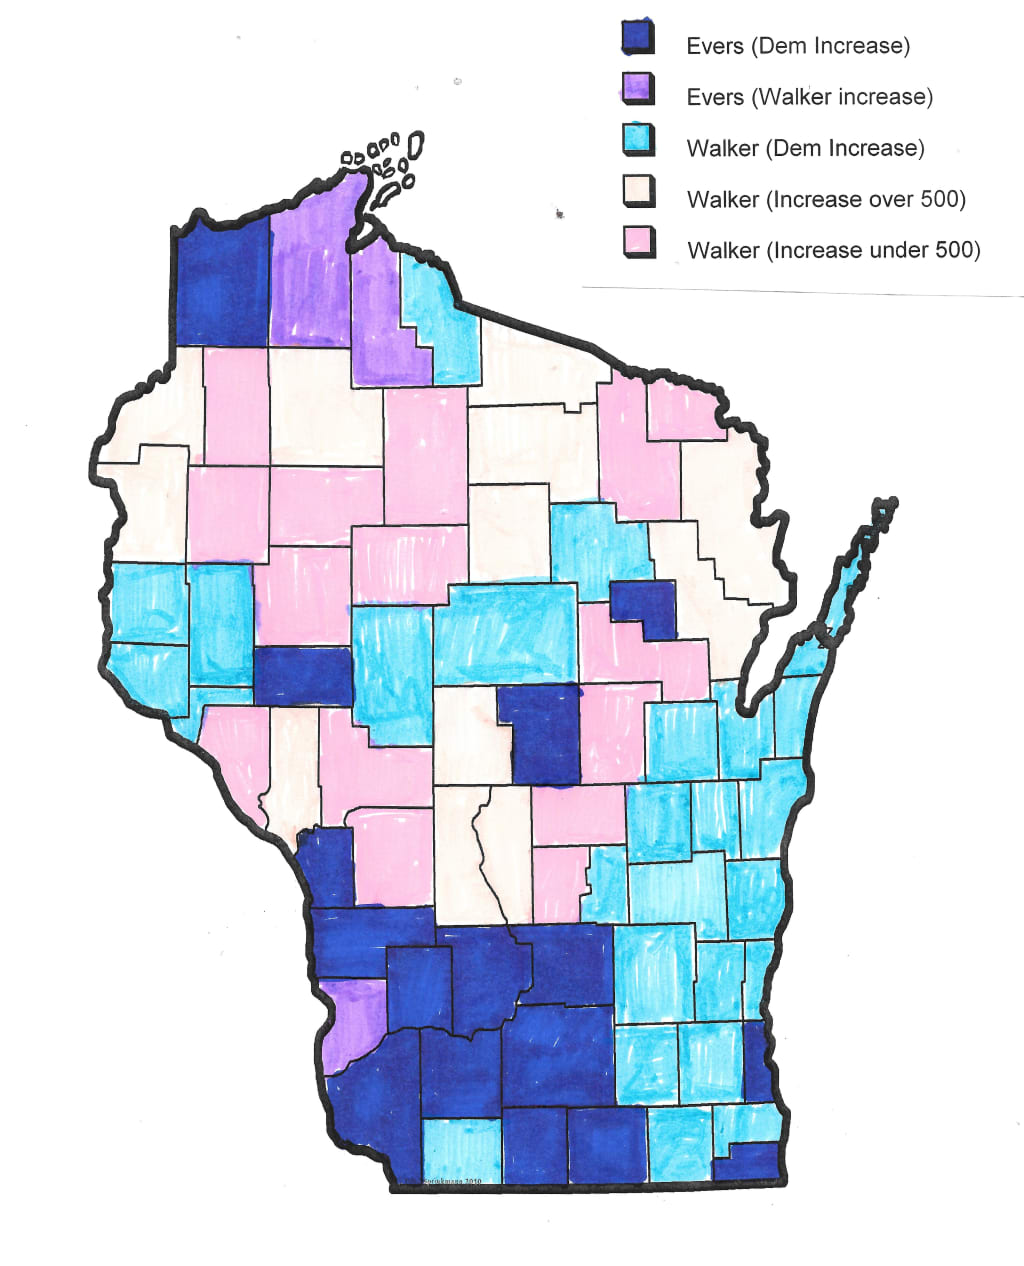
The fatigue can be seen in the numbers. While it is no surprise Democrats turned up in Democratic counties, there was a decline in Walker’s vote in some Republican counties as well. And his increases were not as large as the Democratic increases in many counties.
Suburban Backlash to Trump:
One of Walker’s biggest problems was a huge drop-off in his vote in suburbs surrounding Milwaukee. In Waukesha, Walker received 580 fewer votes than he did in 2014; more importantly, Evers received 17,614 more votes than Burke. This shift of 18,000 votes in Waukesha accounts for over half of Walker’s margin of loss.
Walker also received fewer votes in Jefferson (1160) and Ozaukee (628) counties, while Evers picked up votes in both (1307 and 4696, respectively). Fewer people voted in Jefferson than in 2014, suggesting many Republicans many have stayed home. Ozaukee had more votes, but a shift of over 5300 votes towards the Democratic column.
Democrats Were Fired Up:
In Dane County, there was record turnout, and a shift towards the Democrats of 48,549 votes. While Milwaukee didn’t have quite as large a boost, it was still substantial—Evers gained 39,440 votes over Democratic totals in 2014.
Marijuana, Marijuana:
The issue of marijuana, both medical and recreational, was all over the ballot in 2018. It was in sixteen counties and two cities (Racine and Waukesha). Every single marijuana measure passed, most by over 70 percent. In seven of the eight largest Democratic counties, marijuana was on the ballot. In counties with marijuana on the ballot, turnout increased by an average of 9.8 percent – with phenomenal increases in Kenosha (18.5), LaCrosse (14.8), Dane (14.5) and Rock (13.9) counties.
Perhaps the biggest takeaway for the 2020 election is what happened in Waukesha, Jefferson, Ozaukee and Washington counties. Because if the ordinarily Republican voters in those suburban counties turn away from Donald Trump, he will have an almost impossible time winning Wisconsin again.
Democrats made a clean sweep of Wisconsin’s constitutional offices on November 6, making this the first time since 1986 all five top officers will be Democrats. And while Republicans do control the state legislature, it is by virtue of some of the worst gerrymandering in the nation – Assembly Republicans won 45 percent of the vote, but hold 63 of 99 seats.
For those interested in the raw County by County data, here it is:
- Democratic Counties with a Democratic Increase over 2014 (16):
- Dane: 48,549; Milwaukee: 39,440; La Crosse: 5455; Rock: 5246
- Eau Claire: 4975; Kenosha: 4003 (flip); Sauk: 2195; Portage: 1415
- Green: 1289; Columbia: 1072; Iowa: 928; Grant: 596 (flip)
- Richland: 463 (flip); Douglas: 208; Menominee: 94; Vernon: 41
- Democratic Counties with a Walker increase (3):
- Ashland: 218; Bayfield: 99; Crawford: 14
- Republican Counties with a Democratic increase over 2014 (26):
- Waukesha: 18,194; Brown: 7866; Ozaukee: 5324; Outagamie: 4975
- Winnebago: 4877; Sheboygan: 3054; Racine: 2903; Jefferson: 2467
- Washington: 2521; Walworth: 1911; Calumet: 1783; St Croix: 1399
- Dodge: 1019; Fond du Lac: 968; Door: 932; Langlade: 668
- Manitowac: 635; Dunn: 573; Pierce: 544; Marathon: 446
- Clark: 88; Green Lake: 93; Iron: 166; Kewaunee: 74
- Lafayette: 20; Pepin: 48
- Republican Counties with a Republican increase over 2014 (27):
- Marinette: 1136; Oconto: 993; Adams: 780; Polk: 769
- Lincoln: 756; Oneida: 734; Juneau: 710; Sawyer: 679
- Burnett: 672; Vilas: 603; Trempeleau: 600; Wood: 544
- Waushara: 487; Monroe: 445; Rusk: 401; Chippewa: 395
- Price: 386; Washburn: 299; Taylor: 263; Marquette: 250
- Jackson: 233; Barron: 168; Buffalo: 176; Shawano: 157
- Florence: 139; Waupaca: 95
About the Creator
Keep reading
More stories from John Heckenlively and writers in The Swamp and other communities.
Trump Faces Hurdles in 2020
In 2016, Donald Trump eked out a win in the electoral college by virtue of his strength in the industrial midwest. He did so by outflanking Hillary Clinton on the left, decrying trade deals that had cost factory workers their jobs and promising that he would return prosperity to midwestern states.
By John Heckenlively5 years ago in The Swamp
THE HARDER THEY FALL
MAYORS COME AND GO especially when burdened with an era of dilema from a prior administration. That is not to say thatcarrying off a resolution of any prior political height is not accomplishable by an incoming entity; but it reads like an open book, specific to women of color.
By CarmenJimersonCross-Safieddineabout 3 hours ago in The Swamp
Before Sylvester the Cat, there was Sylvester the Dog
Sylvester was a Merrie Melodies canine Sylvester, the Cat, is a beloved Looney Tunes character who debuted in March 1947 in the animated short Life with Feathers. The iconic Mel Blanc once said that he enjoyed voicing Sylvester, one of his favorite characters. The cartoon short that was near and dear to Blanc's heart was Bird's Anonymous which starred the popular cat.
By Cheryl E Preston2 days ago in Geeks


Comments
There are no comments for this story
Be the first to respond and start the conversation.